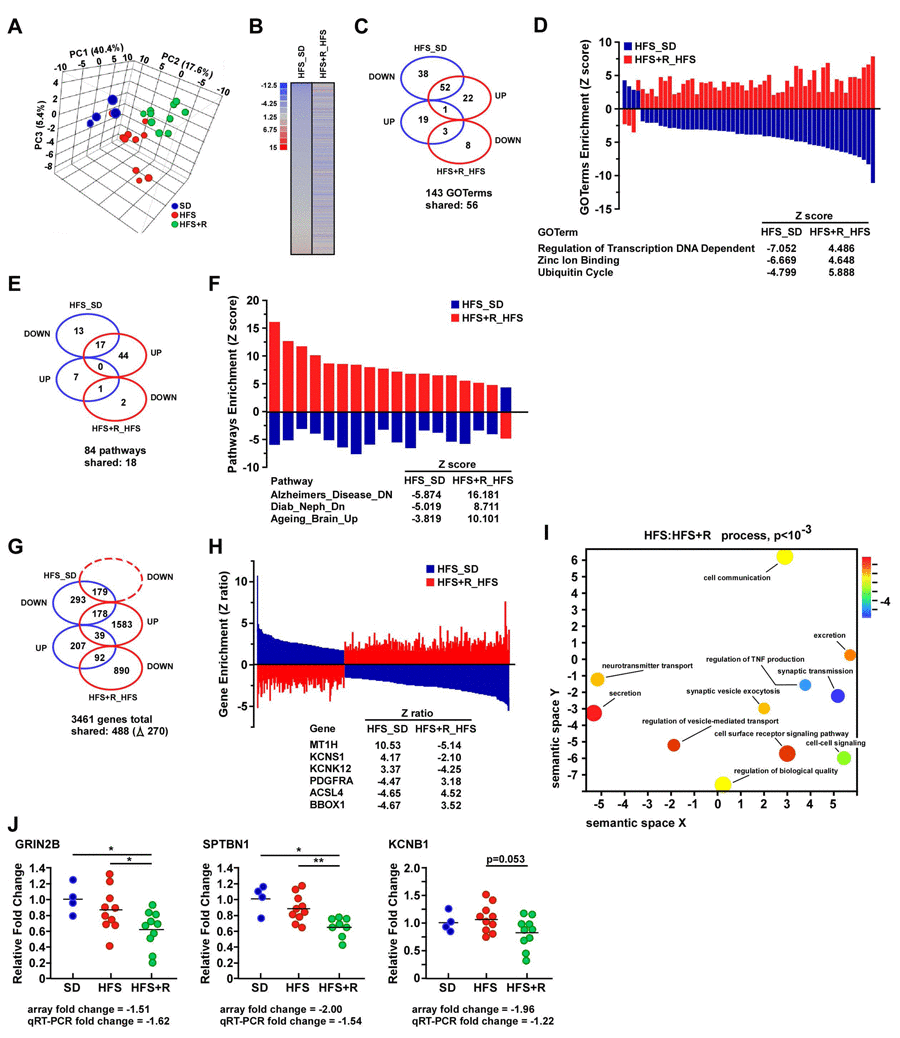
Figure 2.Resveratrol supplementation elicits differential gene expression profiles in the frontal cerebral cortex of HFS-fed rhesus monkeys(A) Visualization of the principal component analysis (PCA) performed on gene expression data sets from the brain of rhesus monkeys maintained on standard diet (SD), high-fat, high-sugar diet (HFS) and HFS supplemented with resveratrol for 2 years (HFS+R). (B) Heat maps representing gene expression profile comparing genes significantly up (red) and downregulated (blue) in HFS vs. SD-fed controls and HFS+R vs. HFS. (C) Venn diagram illustrating the number of significantly up and down regulated GO terms observed in neocortex from HFS vs. SD (blue symbols) and HFS+R vs. HFS-fed monkeys (red symbols). (D) Enrichment of the 56 shared GO terms visualized using a two-dimensional graphical representation of HFS vs. SD (blue bars) and HFS+R vs. HFS (red bars). A list of three shared GOTerms differentially expressed between the two pairwise comparisons is provided. (E) Venn diagram illustrating the number of significantly up and down regulated pathways between the two pairwise comparisons. (F) Enrichment of the 18 shared pathways visualized using a two-dimensional graphical representation of HFS vs. SD (blue bars) and HFS+R vs. HFS (red bars). A list of three shared pathways differentially expressed between the two pairwise comparisons is provided. (G) Venn diagram illustrating the number of significantly up and down regulated genes between the two pairwise comparisons. (H) Enrichment of the 270 shared genes visualized using a two-dimensional graphical representation of HFS vs. SD (blue bars) and HFS+R vs. HFS (red bars). A list of six shared genes differentially expressed between the two pairwise comparisons is provided. (I) 5170 genes from the filtered brain dataset (HFS:HFS+R comparison) were ranked according to their differential expression and given as input to GOrilla. The resulting enriched GO terms were visualized using a two-dimensional graphical representation with color coding reflecting their degree of enrichment/depletion (blue being the strongest). Additional comparisons (HFS vs. SD) on the same filtered dataset highlight the enrichment of relevant GO terms, such as “Synapse part”, “Axon part”, “Oxidation-reduction process” and “Response to axon injury”. (J) mRNA expression analysis in brain cortex by quantitative RT-PCR. Relative expression values were normalized to those of SD-fed control monkeys and represented as scatter plots. Although the fold changes in GRIN2B, SPTBN1 and KCNB1 expression were small [less than a 2-fold change], these were in good agreement with the quantitative RT-PCR data. SD (n=4); HFS (n=10); HFS+R (n=10). *, **, p <0.05 and 0.01, respectively.