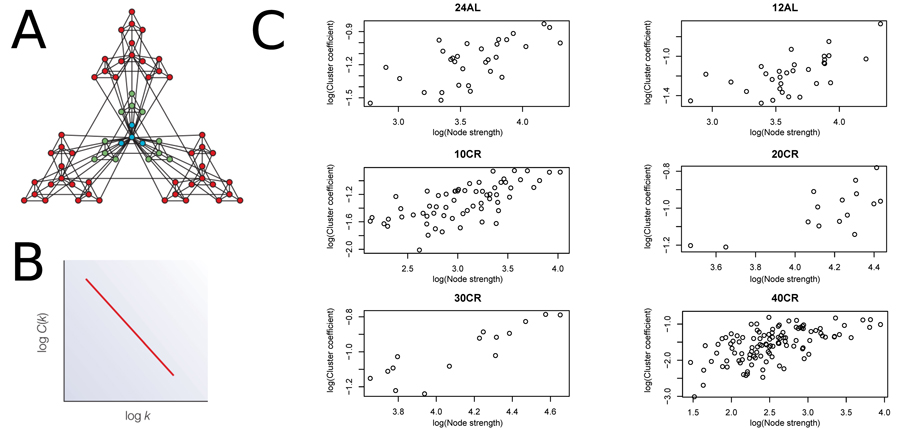
Figure 2.Node strength plotted against clustering coefficient to assess hierarchical topology(A) Visualization of a hierarchical network obtained from [12]. (B) Hierarchical network following a negative relationship between cluster coefficient and node strength. (C) Plots to assess hierarchical topology of aging-associated genes networks. 24AL, 12AL, 10CR, 20CR, 30CR and 40CR refer respectively to 24h ad libitum feeding per day, 12h ad libitum feeding per day, 10 %, 20 %, 30 % and 40 % restriction.
Figure 2 — The effects of graded levels of calorie restriction: VII. Topological rearrangement of hypothalamic aging networks | Aging