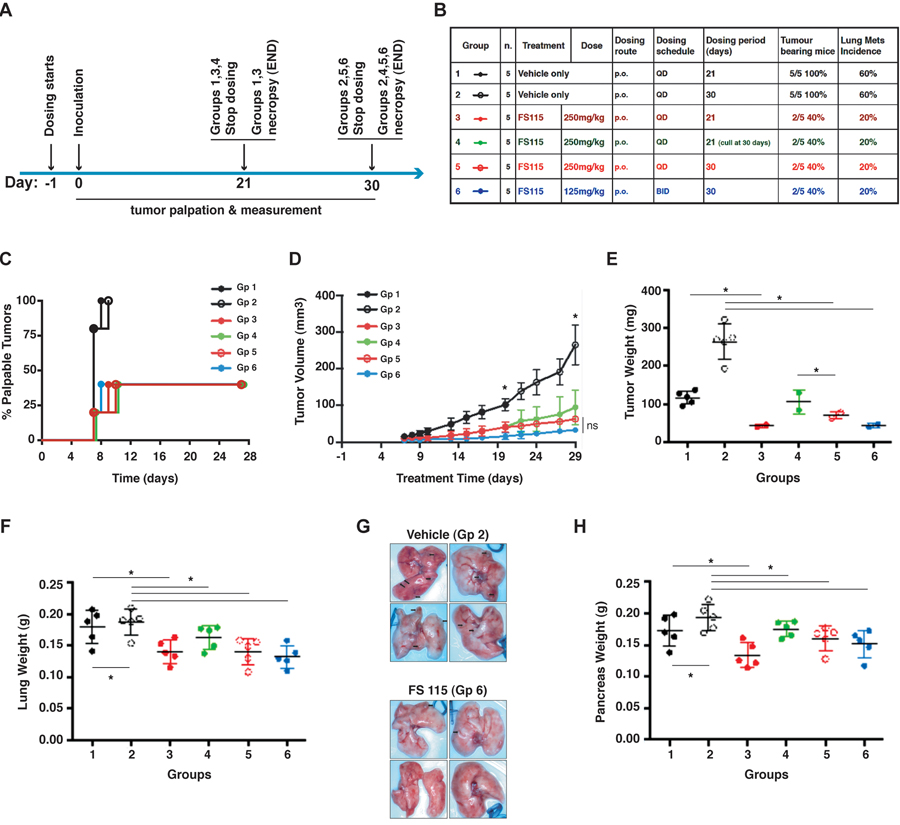
Figure 4.FS-115 reduces tumor take rate and growth(A) Schematic representation of the experimental workflow used for the tumor initiation experiment. (B) Table describes the different experimental groups in which mice were subdivided to test different FS-115 concentrations and different treatment schedules. Percentages of tumor bearing mice and lung metastasis formation in each group are also indicated. (C) Graph reports the time dependent appearance of palpable primary tumors derived from injection of MDA-MB-231 cells (1×10⁶), in the six groups treated as described in (B). (D) Same as in (C) except that tumor volume (mm3) was measured with a caliper. Animals from Group 1 (black line, solid circles) and those from Group 2 (black line, open circles) are combined in the same line until day 21, since they are all treated the same. At day 21, animals from Group 1 are culled, while those from Group 2 continue to be treated with FS-115 and measured, until day 30. The same is true for animals from Groups 3 (red line, solid circles) and Group 5 (red line, open circles). The asterisks at treatment day 20 and 29 indicate that, starting from these time points, there is significant difference (p<0.05) between vehicle (Group 2) and 250mg/kg QD x 30 (Group 5) and between vehicle (Group 2) and 125mg/kg BID x 30 (Group 6). (E) Same as in (D) except that tumor weight (g) was measured at necropsy (21 or 30 days from injection). (F) Same as in (D) except that lung weight (g) was measured at necropsy (21 or 30 days from injection). (G) Pictures show the lungs from two representative experimental groups (Group 2, Vehicle, QD, 30 days and Group 6, FS-115 125mg/kg, BID, 30 days). (H) Same as in (D) except that pancreas weight (g) was measured at necropsy (21 or 30 days from injection). In all graphs, * indicates a p<0.05. In all cases, differences were considered significant when p<0.05 (*) and calculated by two tailed t-test.