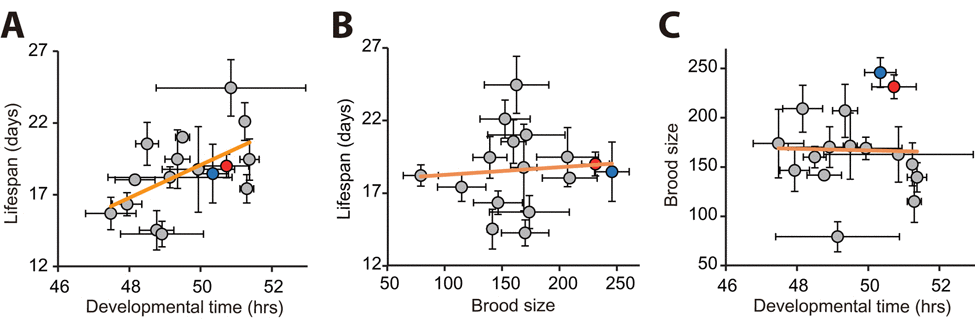
Figure 2.Correlation analysis among developmental time, brood size, and lifespan using populations of wild C. elegans strains(A) Developmental time correlated with lifespan (r = 0.540, p = 0.031). (B-C) In contrast, total progeny number (brood size) did not correlate with lifespan (B; r = 0.081, p = 0.769) or developmental time (C; r = −0.024, p = 0.934). Each circle indicates an average value obtained from independent experiments with populations of each strain. Error bars indicate the standard error of mean (s.e.m.). r values are the Pearson correlation coefficients, and their p values were calculated by using statistical significance test (see Materials and Methods). Orange lines indicate linear regression lines. Data for our laboratory N2 and ancestral N2 were shown as red and blue circles, respectively. Note that FUdR was used for lifespan assays to prevent progeny hatching. See Table S1 for data values and statistical analysis for each strain.
Figure 2 — Inverse correlation between longevity and developmental rate among wild C. elegans strains | Aging