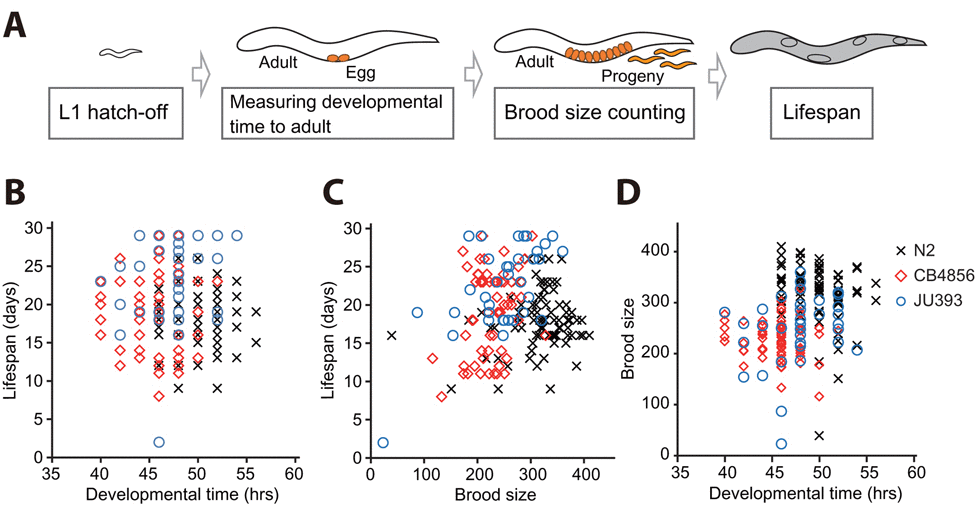
Figure 3.Correlation analysis among developmental time, brood size, and lifespan using individuals of isogenic wild C. elegans strains(A) A schematic for measuring developmental time from L1 hatchlings to adults, brood size, and adult lifespan of isogenic individual worms. (B-C) Lifespan and developmental time (B; r = −0.062, p = 0.405) and lifespan and brood size (C; r = 0.121, p = 0.104) did not display a significant correlation. (D) Developmental time weakly but significantly correlates with brood size (D; r = 0.311, p < 0.001). Marks (crosses for individuals of N2, diamonds for those of CB4856 and circles for those of JU393) indicate corresponding two parameters of individual worms. r values are the Pearson correlation coefficients, and their p values were calculated by using statistical significance test (see Materials and Methods). See Fig. S3 for data values for each strain.