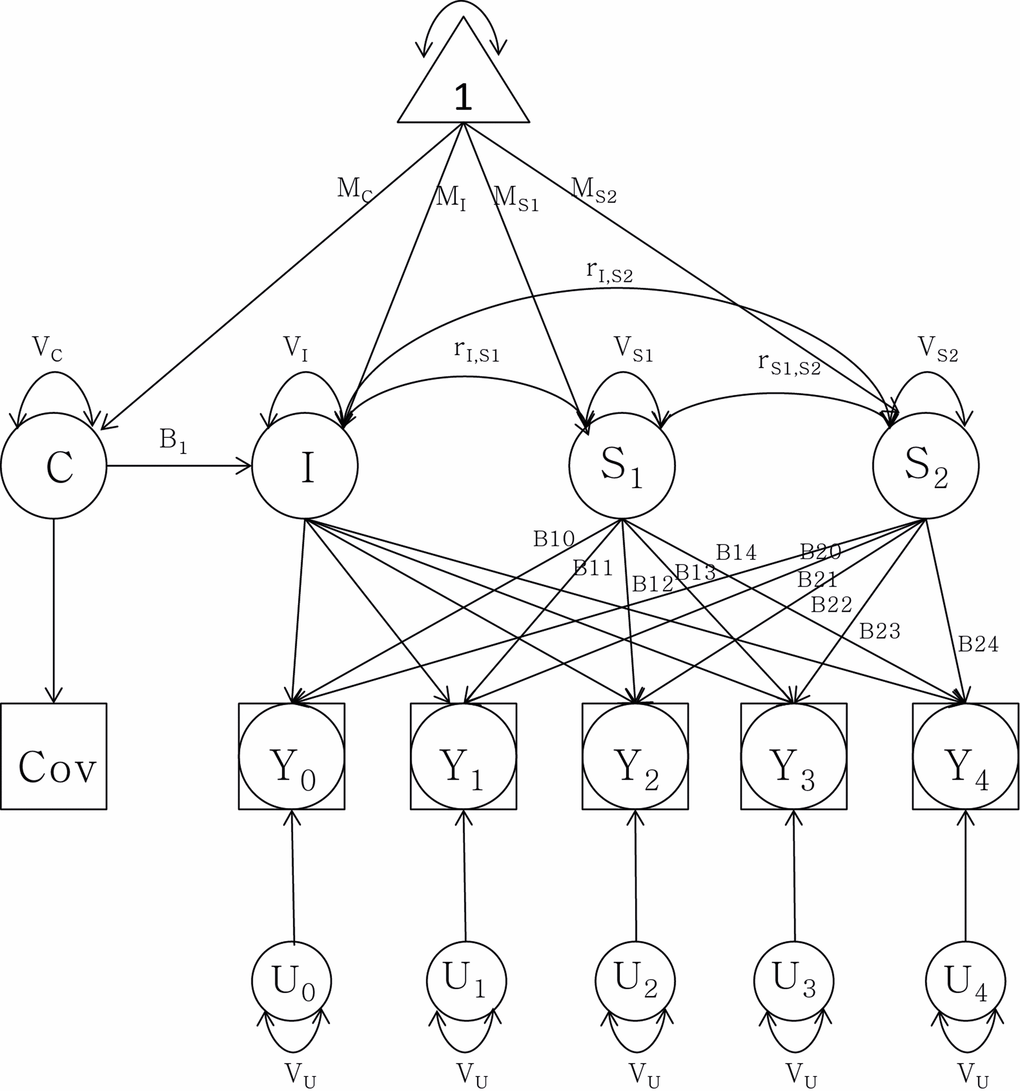
Figure 2.Latent growth curve analysis of telomere length attrition with a group intercept (I) and two slopes (S1) and (S2) as well as sex as covariate (C). Observed data are denoted by Y0 through Y4. MI: mean intercept; MS1: mean slope 1; MS2: mean slope 2; MC: mean covariate. V stands for variance of each component respectively. r denotes the correlation between the intercept and the slopes. B1t through B2t represent the age basis coefficients with change over time t. U0 through U4 represent random components from the telomere length measurements, constrained to be equal for each assessment.