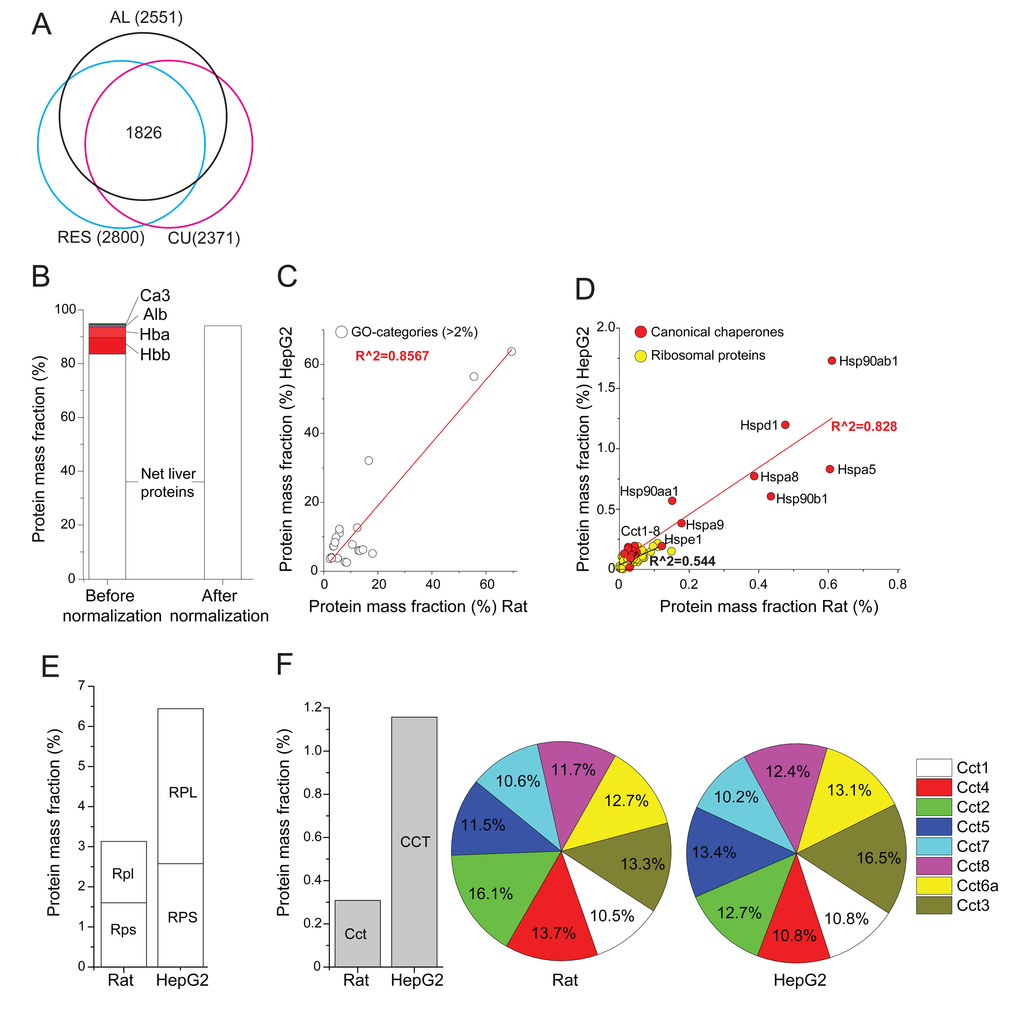
Figure 1.Relative mass fraction values of significantly quantified proteins from rat livers. (A) Venn diagram: numbers (in brackets) of significantly quantified proteins, separately in AL-, RE- and CU livers. The sum of masses of the 1826 significantly quantified proteins in all three treatments was 92% of the total mass. (B) The sum of the relative mass fractions of the 2551 significantly quantified proteins in AL livers, before (left) or after (right) their correction by subtracting the most abundant blood proteins, Hemoglobin (Hba, Hbb), carbonic anhydrase (Ca3) and serum albumin (Alb) and expressing them as net liver cell values. (C) Correlation between the total relative masses of the 21 most abundant gene ontology (GO) categories that contain more than 2% of the total protein mass in AL rat liver cells, as compared to published human HepG2 cancer cells (see Supplementary Table 2). (D) Correlation between the total relative masses of core chaperones (red) and ribosomal proteins (yellow) in AL rat liver cells, as compared to HepG2 cells. (E) Sum of relative mass proportions (%) of the large and small ribosomal proteins in AL rat liver cells (left), as compared to HepG2 cells (right). (F) Sum of relative masses (%) in AL rat liver and HepG2 cells of all CCT chaperonins (grey). (G) Relative mass distribution among the eight homologous subunits CCT1-8 (each differentially colored) in the hetero-hexadecameric chaperonin complex (right).
Figure 1 — Quantitative proteomics of rat livers shows that unrestricted feeding is stressful for proteostasis with implications on life span | Aging