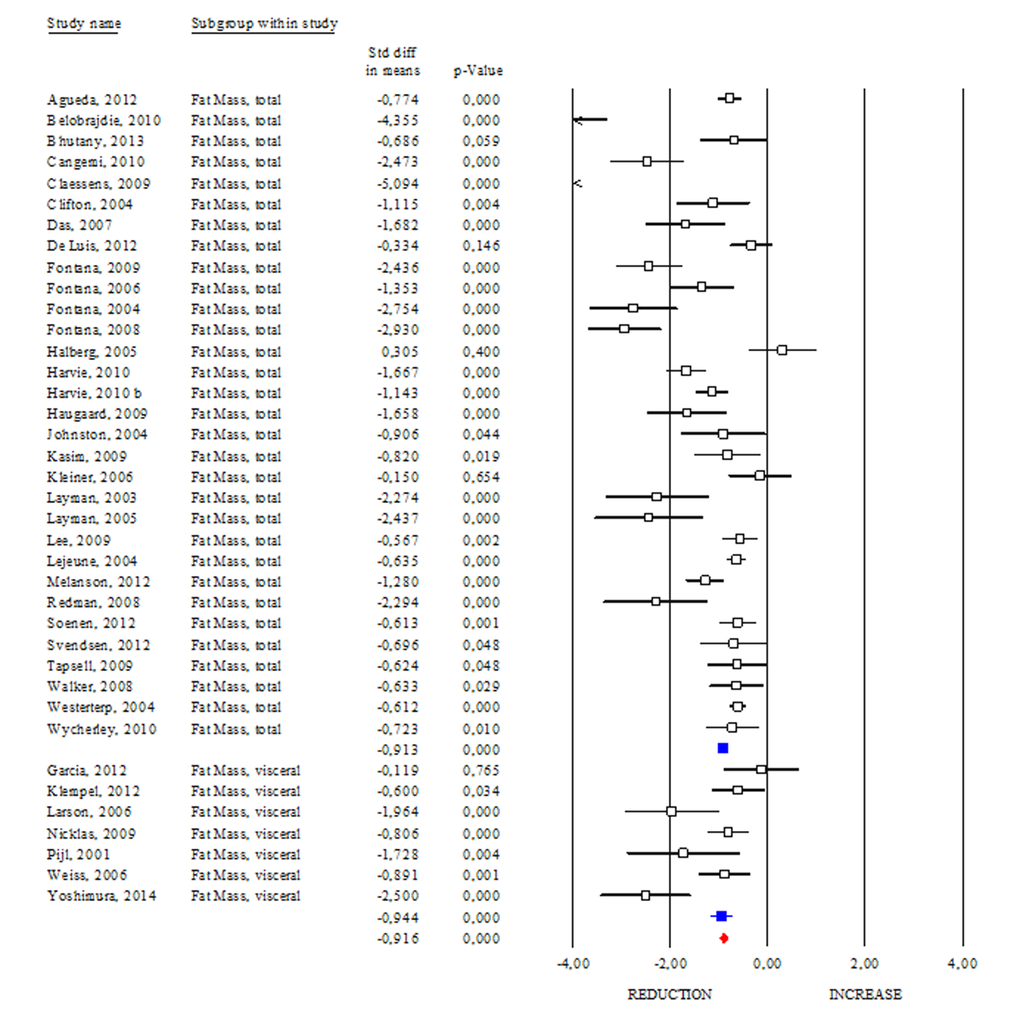
Figure 1.Changes of total and visceral adipose mass after DR. Studies were stratified according to the design of the study. A positive standardized difference in mean (SDM) indicates an increase, whereas a negative SDM indicates the decrease of fat mass (total or visceral). The empty black square indicates the results of each study, whereas empty blu square shows the summary results of each subgroup data. The red diamond resumes overall results of the included studies in the forest plot.