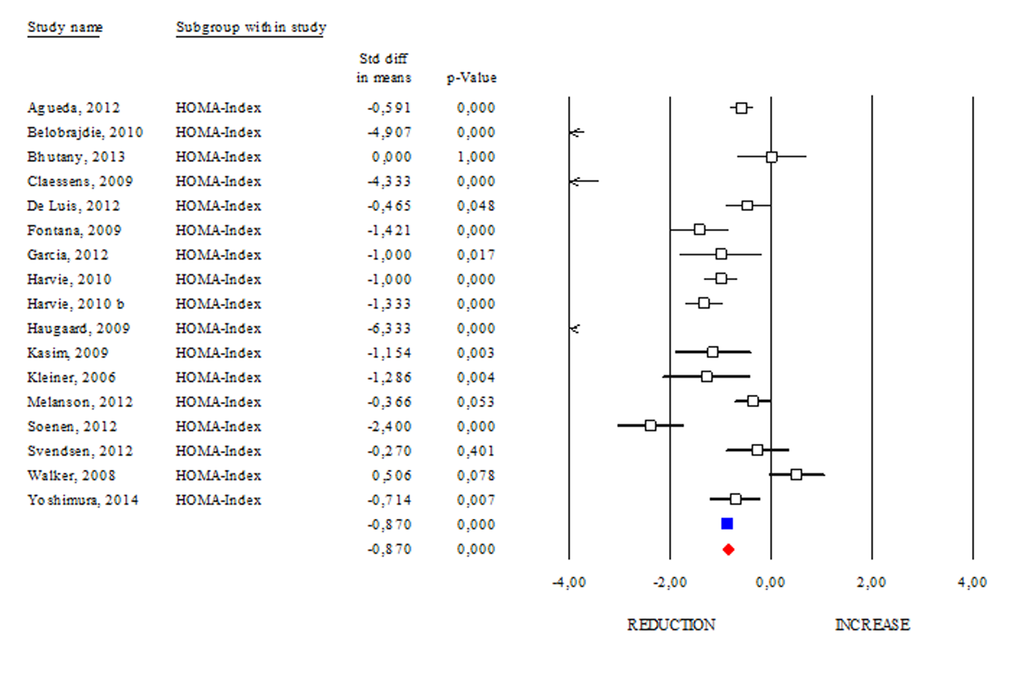
Figure 5.Changes of HOMA Index after DR. Studies were stratified according to the design of the study. A positive standardized difference in mean (SDM) indicates an increase, whereas a negative SDM indicates the decrease of HOMA Index. The empty black square indicates the results of each study. The red diamond resumes overall results of the included studies in the forest plot.