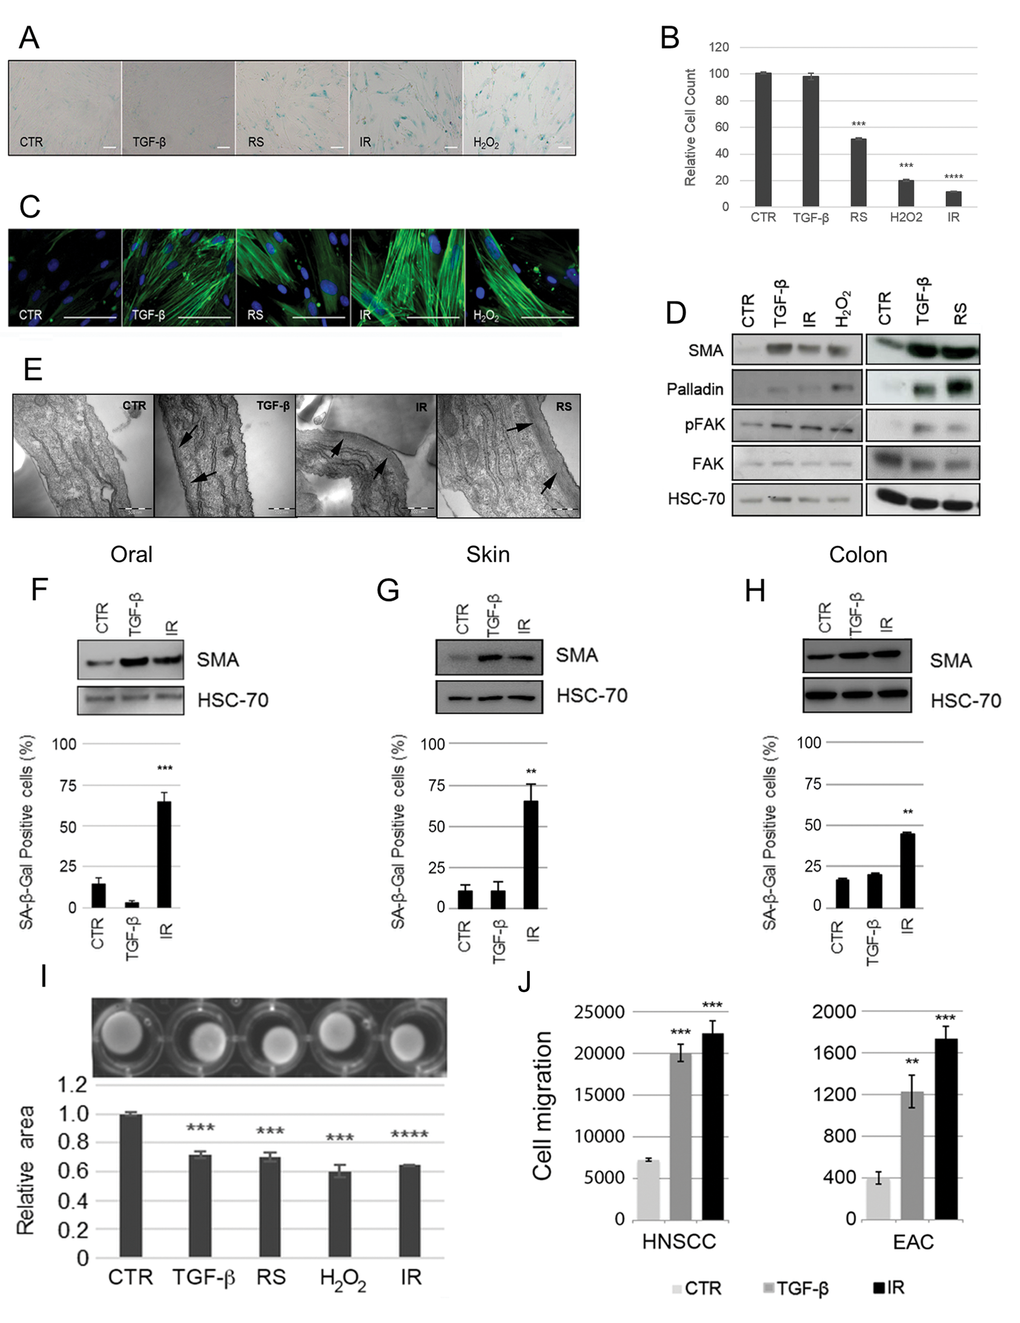
Figure 2.Induction of fibroblast senescence generates a myofibroblastic phenotype. HFFF2 fibroblasts were induced to senesce through serial passaging (RS), treatment with γ-irradiation (10Gy; IR) or H2O2 (1mM). Cells were treated with TGF-β1 (2ng/ml) for 72 hours to induce myofibroblast transdifferentiation as a positive control. 4-6 days post stimuli, induction of senescence was confirmed by (A) expression of SA-β-Galactosidase (SA-β-Gal; Scale Bar indicates 100µm) and (B) proliferation assays (cell counts presented as percentage of cells compared to untreated control cells; see also Supplementary Fig. S2A). Cells were examined for myofibroblast features: (C) Representative images of immunofluorescence for SMA expression (green) with DAPI nuclear counterstain (Blue) (Scale Bar indicates 100µm); (D) Western blotting for SMA, palladin and pFAK (HSC-70 as loading control); (E) Representative images of transmission electron microscopy. Arrows highlight sub-membranous microfilaments (Scale Bar indicates 50nm). (F-H) Western blotting for SMA expression (HSC-70 as loading control) and SA-β-Gal quantification following TGF-β1- and irradiation of primary fibroblasts isolated from oral, skin and colonic mucosa respectively. (I) Representative images of collagen gel contraction assays following treatment of HFFF2 with TGF-β1 or different senescence-inducing stimuli. Histogram shows quantification of gel area expressed as the mean ± SEM of 4 replicates; (J) Transwell migration assays with HNSCC (5PT) and EAC (OE33) cell lines. Conditioned media (CM) from HFFF2 fibroblasts induced to senesce through γ-irradiation (10Gy; IR) or to transdifferentiate into myofibroblasts through TGF-β1 was used a chemoattractant in the lower chamber. Data are presented as mean ± SEM and statistics are shown for T-test compared to controls (*p<0.05, **p<0.01, ***p<0.001, ****p<0.0001). See also Supplementary Fig. S1.