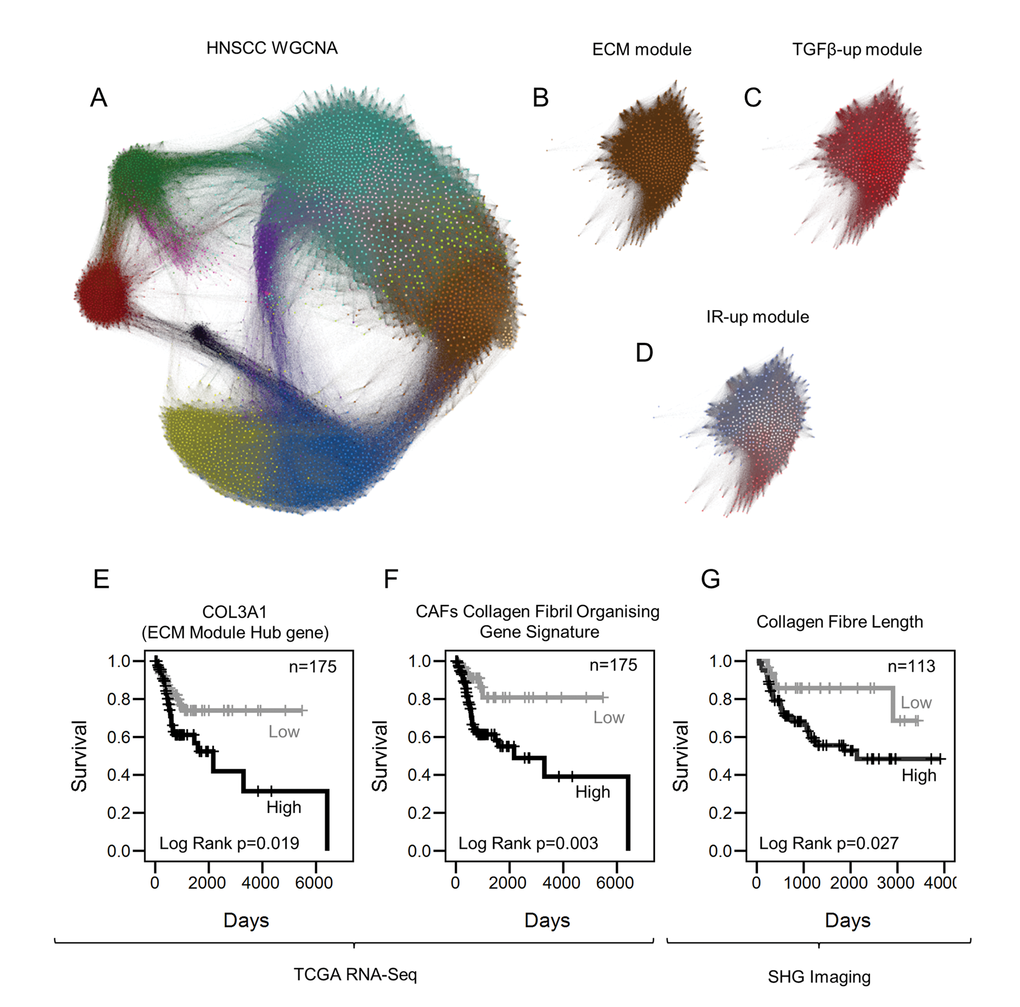
Figure 6.Collagen fiber deposition impacts tumor progression. (A) Gephi network graph where each node represents a gene labelled by color according WGCNA module assignment. Distance between nodes is represented by the TOM connectivity measure. The brown module is the ECM module. (B) ECM module extracted from panel A. (C) Network graph of the ECM module where nodes are color coded according to the correlation with TGF-β1-up DEGs, summarized by a signature eigengene. Red and blue colors show positive and negative correlation, respectively. (D) Correlation of IR-up DEGs with members of the ECM module (color range described above). (E-F) Kaplan-Meier curves showing survival rates in HNSCC patients with greater than average expression of genes associated with myofibroblasts stratified for COL3A1 (E) and CFOG expression (F). (G) Kaplan-Meier curves showing disease specific survival (DSS) rates in HNSCC patients with moderate or high stromal SMA expression (measured by immunohistochemistry), stratified by collagen fiber elongation measured by Second Harmonic Generation imaging. See also Supplementary Fig. S5.