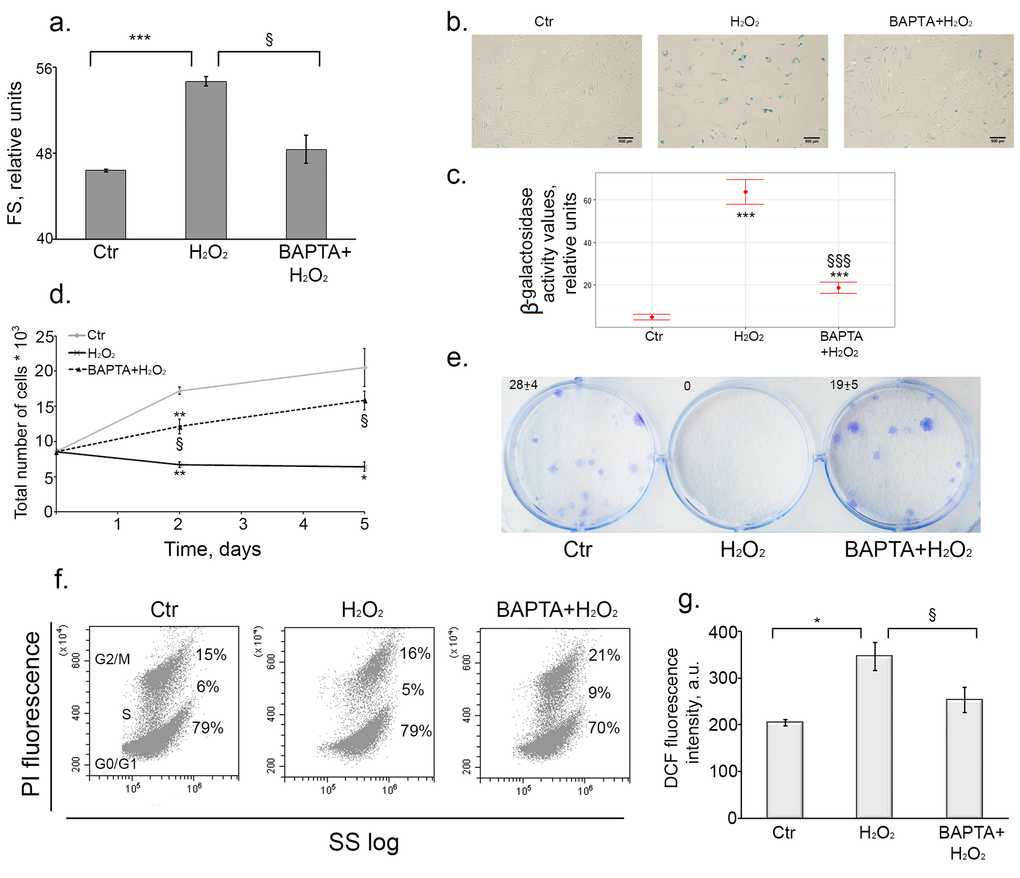
Figure 4.Intracellular calcium chelation by BAPTA prevents oxidative stress-induced senescence of hMESCs. Cells were treated as indicated in the legend to Figure 3. (a) BAPTA partially prevented H2O2-induced increase of cell size. Cell size was determined at day 6 after the oxidative stress. Forward scatter (FS) reflects the average cell size. (b) SA-β-Gal staining of untreated, H2O2-treated and (BAPTA+H2O2)-treated hMESCs. In 5 days after the oxidative stress cells were harvested by trypsinization and plated at a density of 4.5*103 cells per cm2 and additionally cultured for 5 days, in order to perform staining in non-confluent cultures. Scale bar is 500 µm and valid for all images. (c) Quantification of β-galactosidase activity values in control, H2O2-treated and (BAPTA+H2O2)-treated hMESCs. (d) BAPTA retained cell proliferation as compared to H2O2-treated cells. Cell number was determined by FACS at indicated time points. (e) BAPTA pretreated hMESCs maintained the colony forming ability. In 14 days after oxidative stress cells were fixed and stained to monitor cell growth. (f) [Ca2+]i chelation in H2O2-treated resulted in cell cycle phase re-distribution. Flow cytometric analysis of cell cycle phase distribution: the percentage of cells in the G0/G1, S, and G2/M phases, visualization of phase distribution is based on light-scattering analysis. SS log - side scattering. (g) Intracellular ROS levels detected at day 6 after H2O2 stimulation by FACS analysis after staining with H2DCFDA. Images shown are representative of experiments performed at least three times. Graphs are presented as M ± Std.dev., and the Student’s t-test was used to determine p-value. *p˂0.05, **p˂0.005, ***p˂0.001, versus control; §p˂0.05, §§§p˂0.001, versus H2O2-treated cells. Ctr – untreated cells.
Figure 4 — Calcium alterations signal either to senescence or to autophagy induction in stem cells upon oxidative stress | Aging