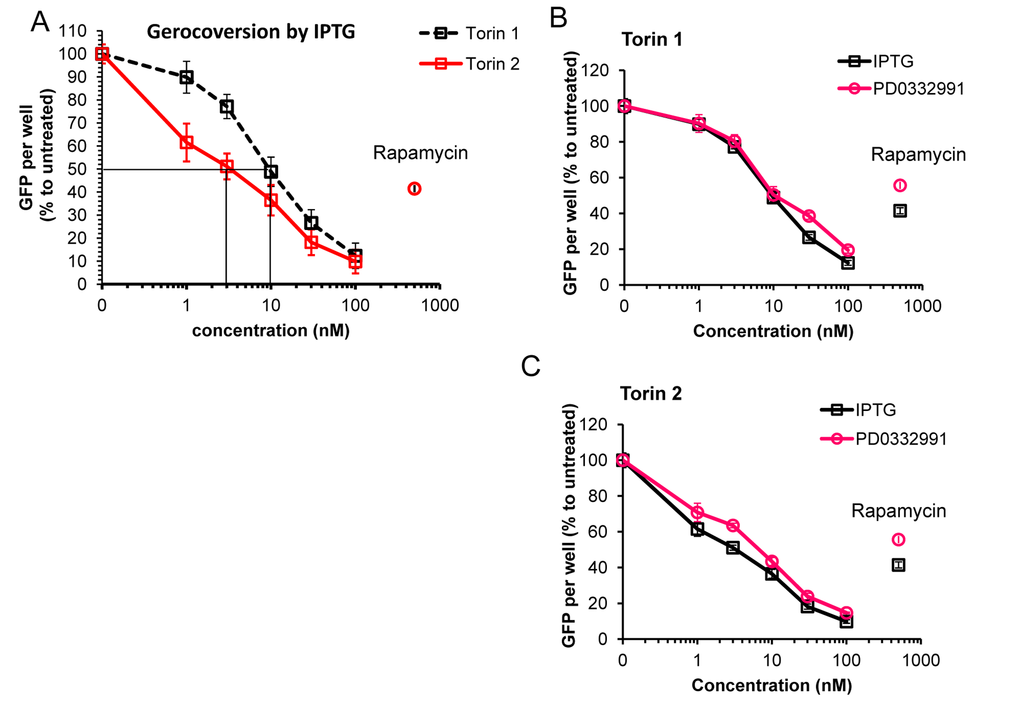
Figure 4.Effect of torins 1 and 2 on hypertrophy of senescent HT-p21 cells measured by constitutive GFP fluorescence of these cells. (A) HT-p21 cells were treated with IPTG and concentration range of torin1 or torin 2, rapamycin (500 nM) was included for comparison as additional control. After 4 day-treatment GFP fluorescence was quantified using Typhoon scanner (Amersham Biosciences variable mode imager) and ImageQuantTL software. (B) and (C) HT-p21 cells were induce to senesce by treatment with either IPTG (3 days) or PD0332991 (0.5 µM, for 4 days) and concentration range of torin 1 (B) or torin 2 (C). Effect of torins on hypertrophy was assessed by measuring GFP fluorescence as described in (A). GFP per well is presented as % to IPTG or PD0332991 only treated cells for each set. Data are means ± SE of 8 replicates from one out of three independent experiments.