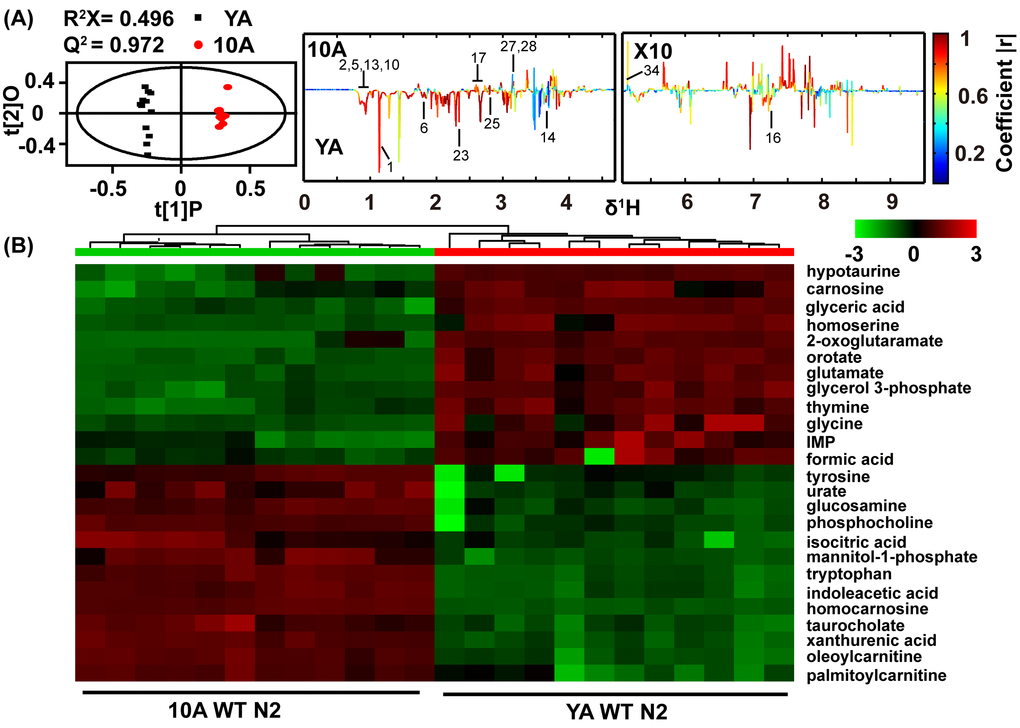
Figure 1.Age-related comprehensive metabolomics analysis in wide type C. elegans. (A) Scores and loading plots from OPLS-DA model of NMR data for YA (young adult) and 10A (10 days of adulthood) wild-type N2. The region of δ5.0-9.5 in the loading plot was vertically expanded 10 times. NMR metabolites assignment showed in the Table S1 (Supplemental information). (B) Metabolomics analysis from UPLC-MS data for YA and 10A wild-type N2. Heatmap plot showed that 25 most importantly different metabolites from the samples according to their aging status. More differences metabolites were listed in the Table S2 (Supplemental information). Data are presented using hierarchical clustering (Pearson’s correlation coefficient). Metabolite abundance level were reflected in the heat-maps using colors, and with blue being lower and red higher when comparing the mean metabolite abundance value. Using the distance function 1-correlation in hierarchical clustering determine the order of metabolite and animal.