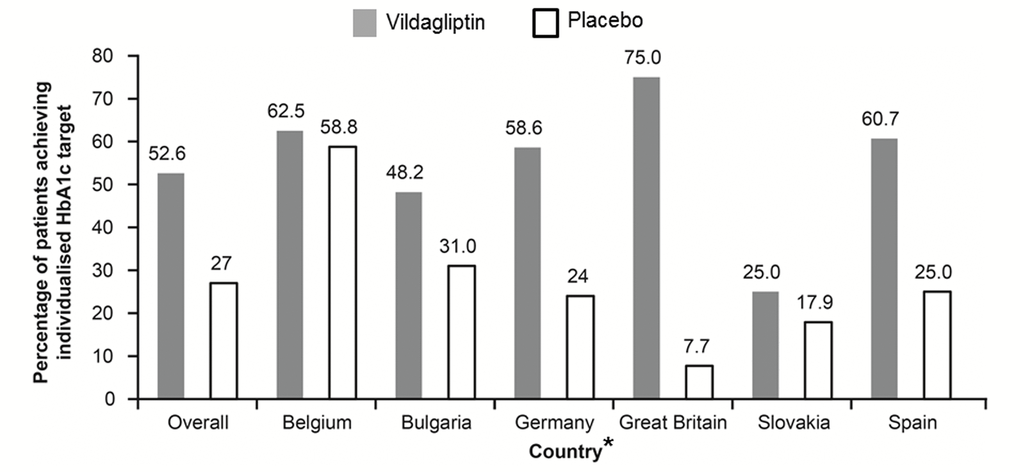
Figure 3.Summary of individualized HbA1c target response (overall and by country). *Patients from Finland were identified by a single investigator. The figure estimates the difference between adjusted means for different factors potentially driving the individualized target setting and thus no reliable statistics for such a low sample size (n=2) could be generated. Hence, Finland has been removed.