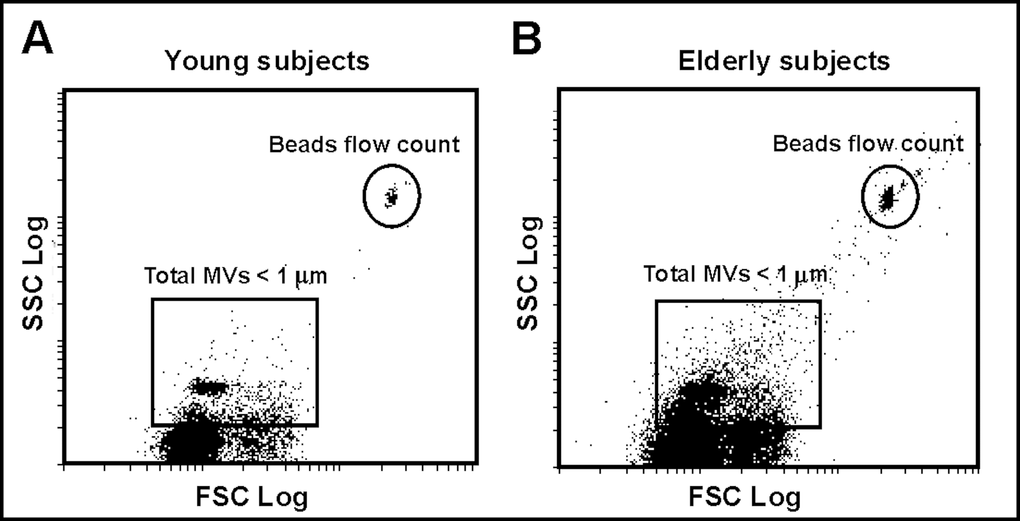
Figure 1.Plasma MVs assessed by flow cytometry. (A) Representative dot plot showing log forward scatter (FSC) vs. log side scatter (SSC) localization of MVs in a young subject. The upper right gate shows the bead flow count, used as an index to count MVs in absolute terms. The lower left gate shows MVs smaller than 1 µm. (B) Representative dot plot showing localization of MVs in an elderly subject.