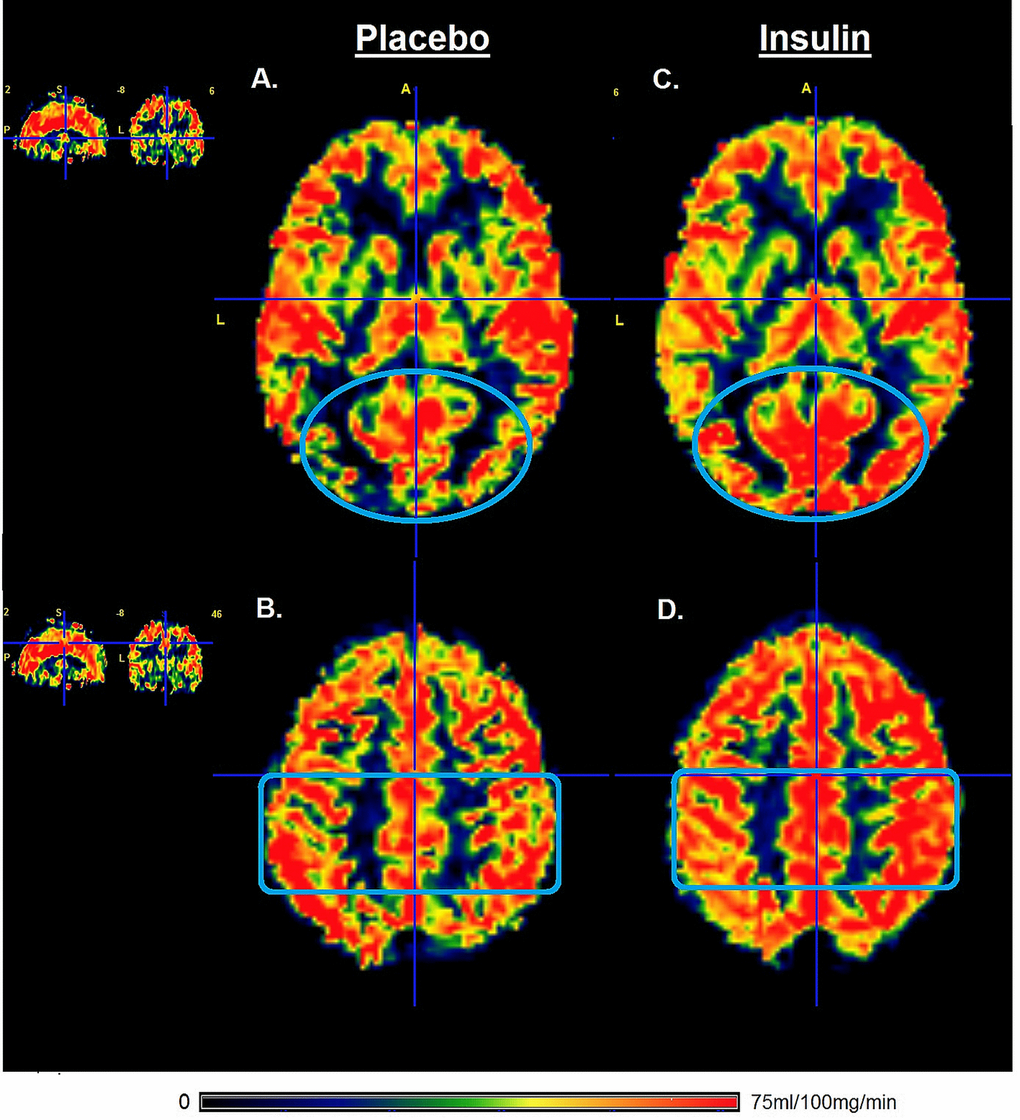
Figure 2.Gray matter perfusion maps after intranasal administration of placebo and insulin. Left panel (A and B) represents the gray matter perfusion map after intranasal placebo administration and the right panel (C and D) the perfusion map after intranasal insulin administration for one representative older participant. The top row shows an increase in the gray matter perfusion of occipital lobe (illustrated by blue oval) after intranasal administration of insulin compared to placebo. The bottom row shows an increase in gray matter perfusion in the parietal lobe (illustrated by blue rectangle) after intranasal administration of insulin compared to placebo. Only the gray matter was included for calculation of perfusion after intranasal administration of insulin compared to placebo.