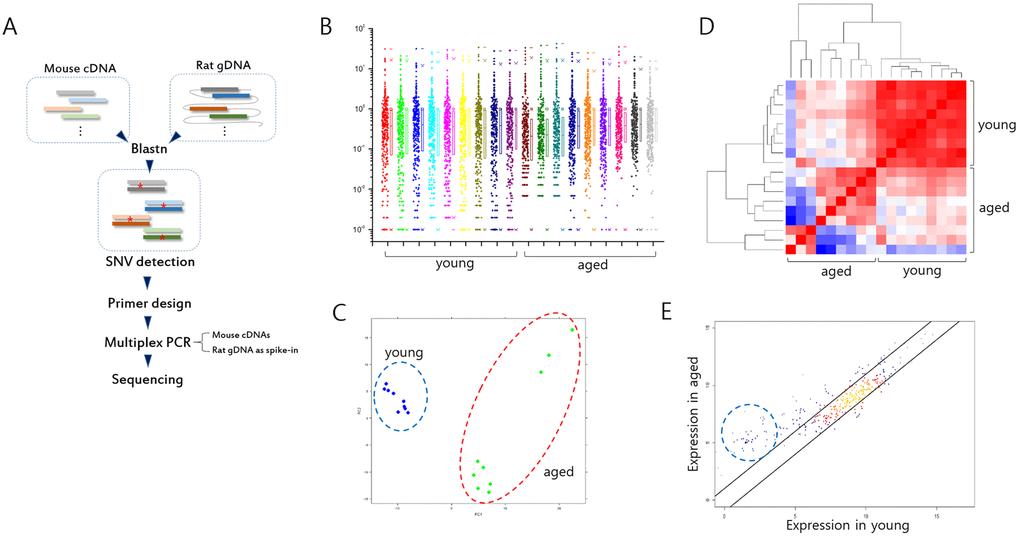
Figure 1.Analysis of gene expression in splenic T cells from mouse models of Huntington’s disease (HD). (A) Illustration of spiking-in neighbor genome PCR (SiNG-PCR) sequencing. (B) Distribution of relative counts of target-gene amplicons in young and aged HD mice. The ratio (M/R) of cDNA counts relative to rat spike-in counts was calculated to measure the expression level of each target amplicon. (C) Principal component analysis (PCA). Both young and aged sample groups are marked using colored circles. (D) Heatmap illustrating Pearson correlation between young and aged group samples. (E) Scatter plot (r = 0.9). Those of amplicons whose negligible expressions in the young group are markedly enhanced in the aged group are circled.