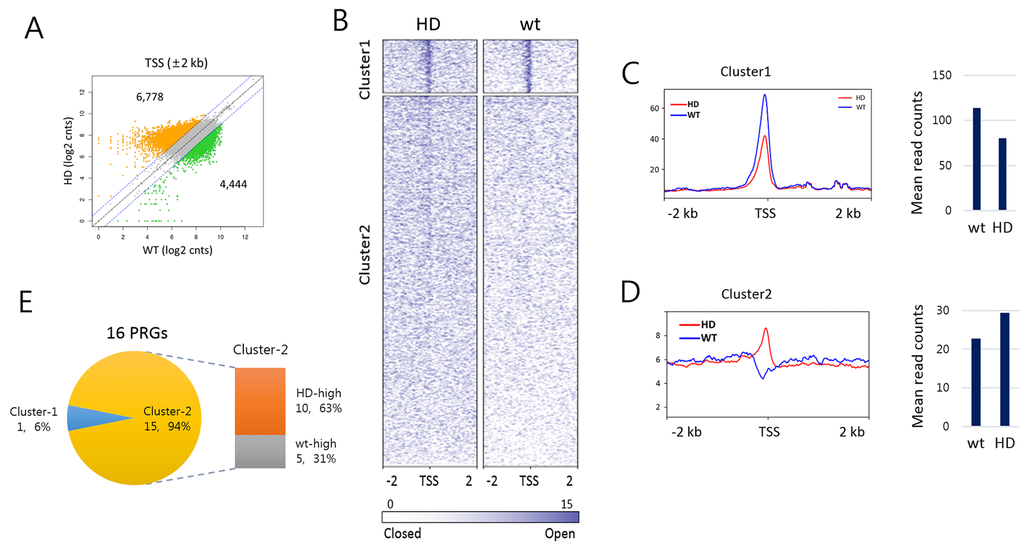
Figure 6.DNase-I hypersensitive site profiling in aged Huntington’s disease (HD) and wild-type splenic cells. (A) Scatter plot of DNase-I hypersensitive (DHS) read counts (log2) between HD and wt around transcription start site (TSS). DHS reads ± 2 kb around TSSs were counted. Colored dots (orange for HD-high and green for wt-high) indicate DHSs reads with 2-fold or more count differences. (B) Heatmaps of DHS signals around TSSs (± 2 kb) in HD and wt mice. DHS signals were clustered by the k-means algorithm (k = 2). Sites are ordered by DHS signal intensity around TSS. (C-D) Read count distribution around TSSs (± 2 kb, left) and the mean DHS signal density around TSSs (± 300 bp, right) in cluster-1 (C) and cluster-2 (D). (E) Comparison of DHS signal density at PRG TSSs between HD and wt samples. Shown are the proportions of PRGs with HD-high (orange) and wt-high (gray) DHS signals. Of the 16 PRGs, 15 PRGs belong to cluster-2 and 10 (63%) have denser signals in HD sample than in wt.