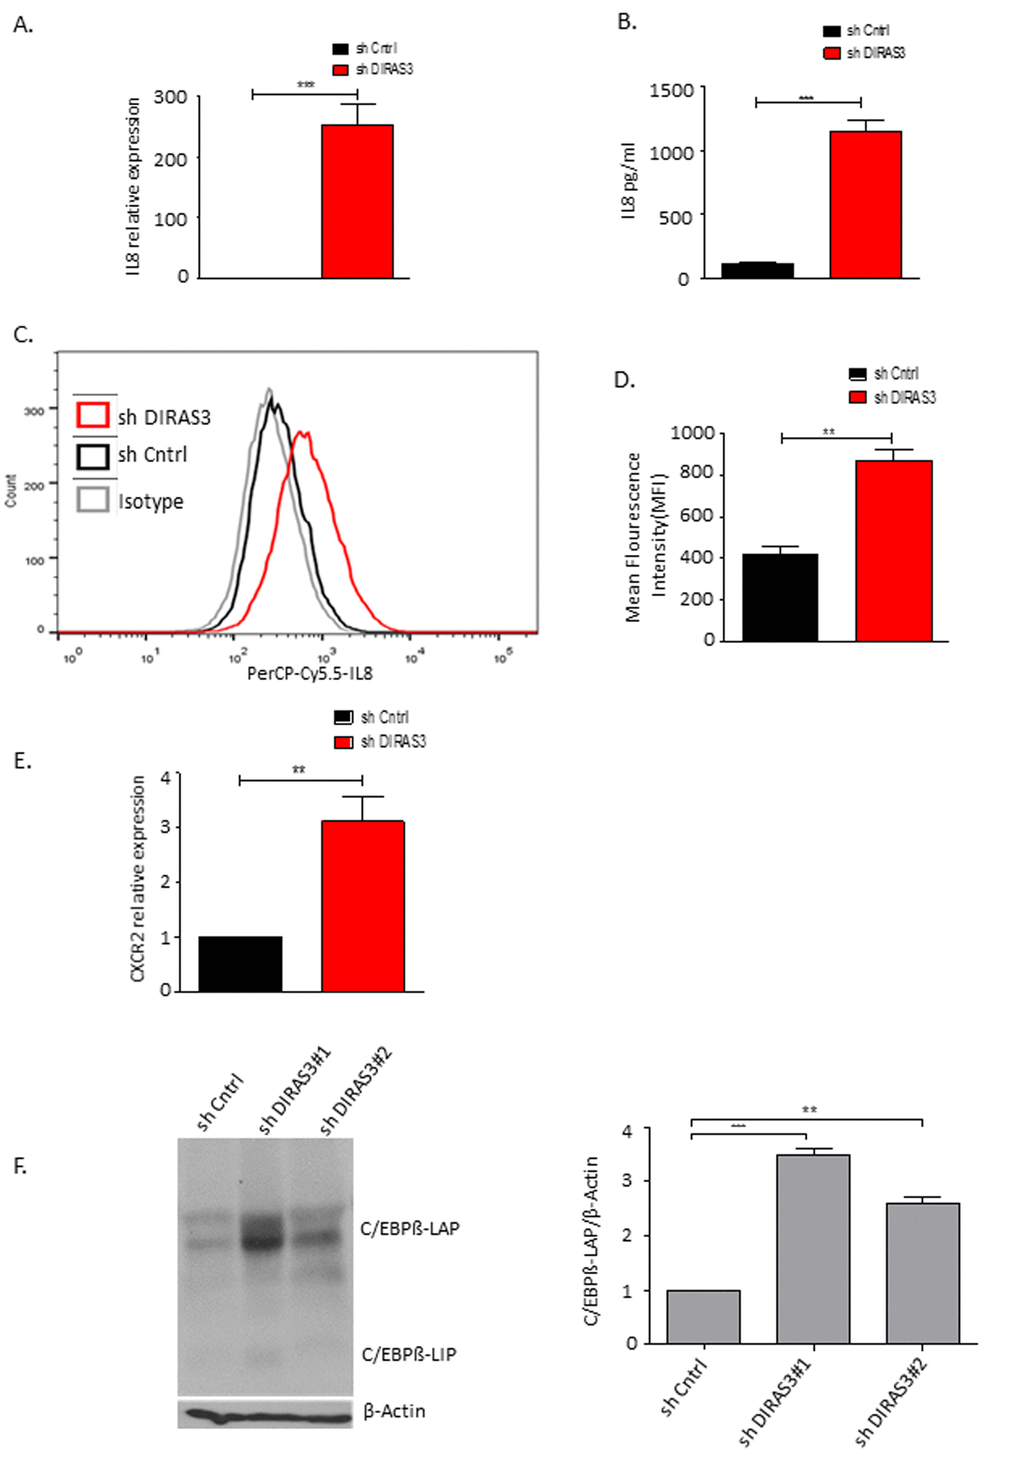
Figure 4.DIRAS3 KD induced senescence lead to higher production of IL-8. (A) IL-8 mRNA was quantified using q-RT PCR upon DIRAS3 KD (n=4). (B) IL-8 protein level in cell culture supernatant was quantified by ELISA (n=3). (C and D) Differentially transduced ASCs were incubated for 4 hours with brefeldin A (5µg/ml) – a protein transport inhibitor from Endoplasmic reticulum to Golgi complex, followed by fixation and permeabilization. Cells were stained by PerCP-Cy5.5-IL-8 antibody and analyzed by FACS (n=2). (E) CXCR2 mRNA was quantified using q-RT PCR upon DIRAS3 KD (n=4) (F) (Left panel) C/EBPβ protein level upon KD of DIRAS3 was analyzed by immune-blotting using anti-C/EBPβ antibodies. β-Actin served as input control. (Right panel) Fold changes in densitometric band intensities for phosphorylated proteins normalized to un-phosphorylated total proteins, acquired by image J were compared. Band intensity of shCntrl was taken as 1. Western blot shown is from replicate from one donor with similar protein expression pattern was observed with 2 different donors. All error bars represents the means ± SEM. p values * = p<0.05, **= p<0.001 and *** = p<.0001.