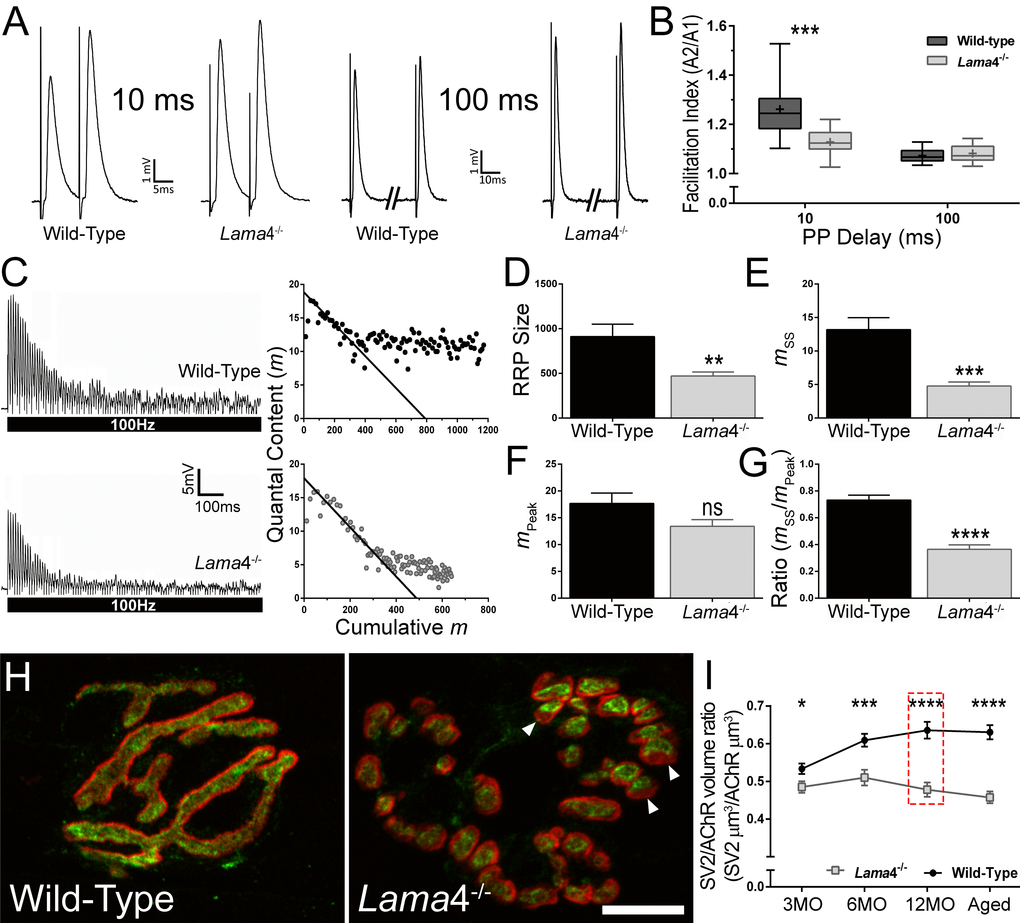
Figure 4.Lower facilitation and higher synaptic depression associated with decreased vesicle density at 12MO lama4-/- neuromuscular junctions in EDL muscle. (A) Sample traces of paired-pulse facilitation at 10 ms and 100 ms delay for 12MO WT and lama4-/- NMJs. (B) Plot of facilitation ratio against paired-pulse delay times at 10 ms and 100 ms. (C) Representative EPPs recordings during 100 Hz stimulation for 1 s duration at 12MO WT and lama4-/- NMJs. Estimation of RRP size was determined by plotting the y-axis (quantal content) over the x-axis (cumulative quantal content) and extrapolating the linear declining phase at x-axis. (D) RRP size, (E) quantal release during steady state plateau (mss), (F) quantal release during the first ten stimuli (mPeak) and (G) ratio of mss to mPeak measured between genotypes at 12MO. (H) Representative staining of synaptic vesicle 2 (SV2; green) with respect to postsynaptic AChRs endplate (red) at 12MO. Lama4-/- NMJ clearly displayed lower degree of overlap between SV2 and postsynaptic AChRs endplate (as indicated by arrow heads) which was not observed in WT NMJ. Scale bar = 10 µm. (I) SV2/AChR volume ratio was measured across all ages investigated. The difference in SV2/AChR volume ratio between both genotypes was evident at 12MO (as indicated in red dashed line box). (B) n = 4, NMJs = 13-15 per genotype. (D-G), n = 4, NMJs = 12 for both genotypes. (I) n = 3, NMJs = 51-82 per genotype at each age group. Statistical analyses were performed using Student’s t-tests for (B, D-G, and I); values are presented as mean ± SEM (* P < 0.05, ** P < 0.01, *** P < 0.001, and ****P < 0.0001).