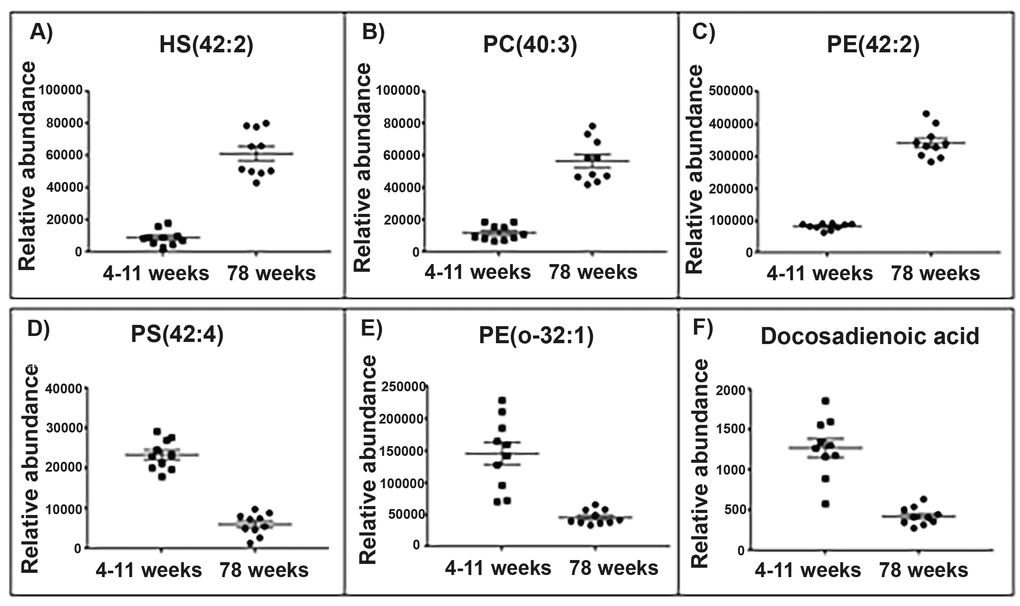
Figure 2.Top lipid species changed with age in the brain mitochondrial lipidome. Scatter plots (A-C) display the top three lipids that increase in abundance in the aged (78 weeks) brain mitochondria compared with young (4-11 weeks) brain mitochondria (old n=10, young n=10). Scatter plots (D-F) display the top three lipids that decrease in abundance in the aged brain mitochondria. (A) The lipid 906.632 tentatively identified as hydroxyl sulfatide (42:2) significantly increases in abundance by a fold change of 6.74 in the aged brain mitochondria. (B) The lipid m/z 826.672 tentatively identified as phosphatidylcholine (40:3) significantly increases in abundance by a fold change of 4.68 in the aged brain mitochondria. (C) The lipid m/z 810.643 tentatively identified as phosphatidylethanolamine (42:2) significantly increases in abundance by a fold change of 4.17 in the aged brain mitochondria. (D) The lipid m/z 866.594 tentatively identified as a phosphatidylserine (42:4) significantly decreases in abundance by a fold change of 3.83 in the aged brain mitochondria. (E) The lipid m/z 732.588 tentatively identified as phosphatidylethanolamine (o-32:1) significantly decreases in abundance by a fold change of 3.19 in the aged brain mitochondria. (F) The lipid m/z 335.295 tentatively identified as a docosadienoic acid (C22:4) significantly decreases in abundance by a fold change of 3 in the aged brain mitochondria. Scatter plots display abundance ± SEM. We used Wilcoxon rank test and Bonferroni correction (p<0.05). Lipids were identified using Lipid Maps and Human Metabolome databases. Refer to Supplementary Tables 3 and 4 for the top 50 lipid changes. Abbreviations: hydroxyl sulfatide (HS), phosphatidylcholine (PC), phosphatidylserine (PS) and phosphatidylethanolamine (PE).