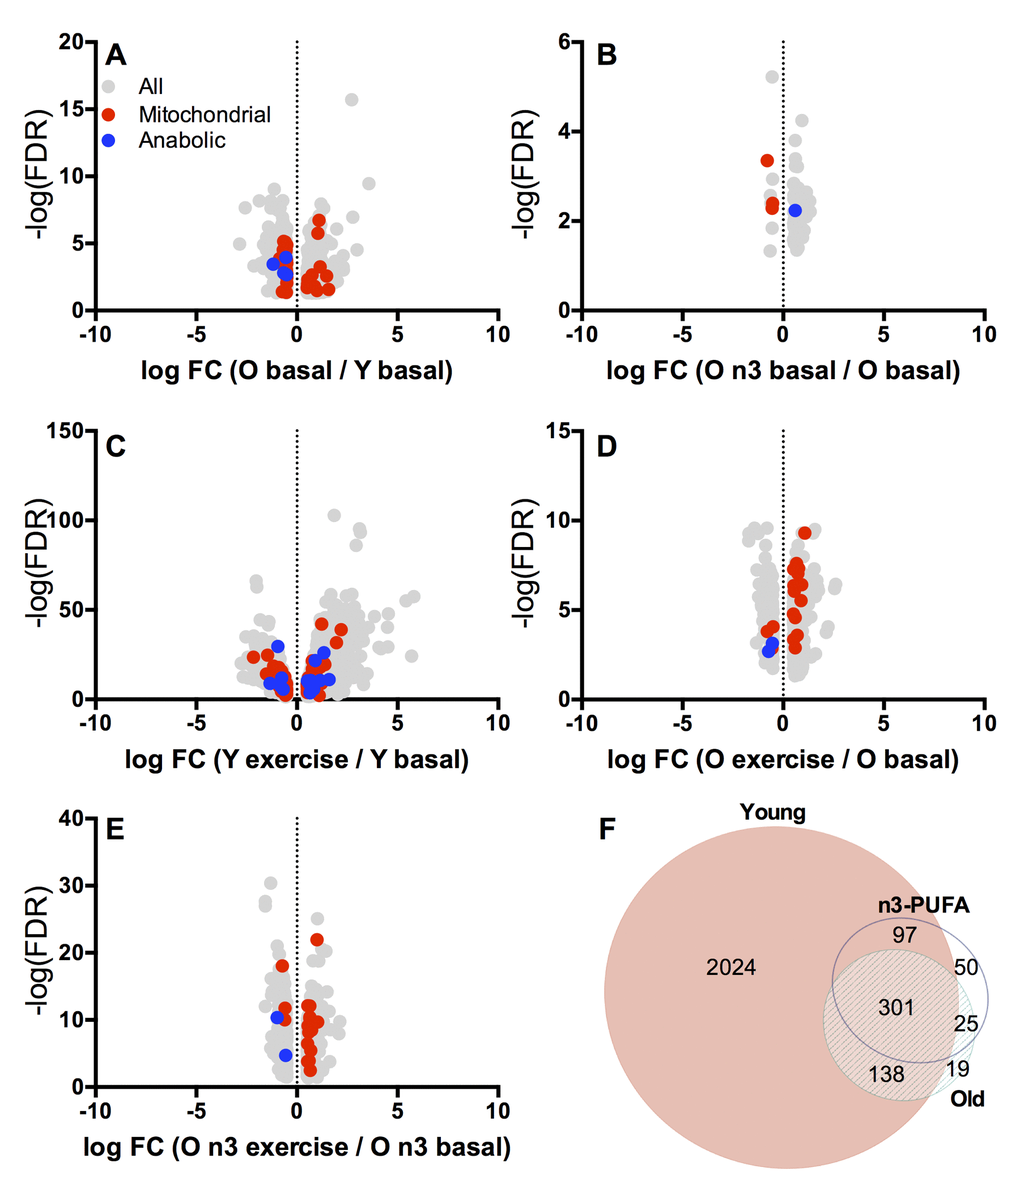
Figure 5.Whole muscle transcriptomics. Transcriptional patterns in skeletal muscle were evaluated by RNA sequencing. Volcano plots (A-E) show log fold change (FC) vs. –log false discovery rate (FDR) for transcripts that were significantly (p≤0.05) different between young and old at baseline (A), old before and after intervention at baseline (B), young before and after exercise (C), old before and after exercise (D), and old before and after exercise following n3-PUFA supplementation (E). Downregulated genes are on the negative x axis while upregulated genes are on the positive x axis. Mitochondrial related genes are red and genes involved in muscle protein metabolism are blue. The Venn Diagram (F) shows transcripts (Supplemental Table 2) that were differentially expressed with exercise in Young, Old (pre-intervention) and Old n-3 (post-intervention).