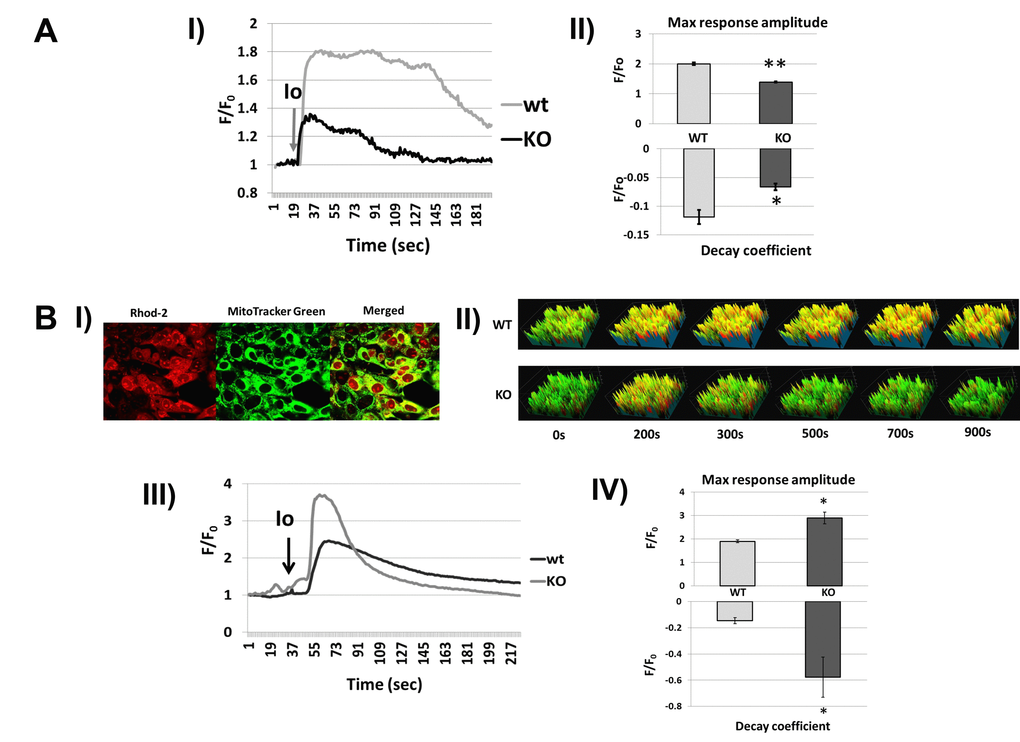
Figure 7AB.Fus1 KO cells show aberrant [Ca2+]c and [Ca2+]m responses to different stimuli that were improved by inhibiting the mitochondrial sodium/calcium exchanger (mNCX). (A) [Ca2+]c changes in Fus1 KO and WT iKEC in response to the calcium agonist Ionomycin. Panel I shows dynamic [Ca2+]c levels in WT and Fus1 KO iKEC after treatment with Ionomycin (Io, grey arrow) detected by Fura-2 Ca2+-sensitive fluorescent probe. Ratio 340/380 for Fura-2 in Io-stimulated iKEC (F) was normalized to the fluorescence value of control levels (without Io, Fo); Panel II shows parameters of [Ca2+]c response induced by Ionomycin in WT and Fus1 KO iKEC: maximal amplitude of response (upper section) and coefficient of decay phase (lower section). The level of statistical significance is designated as *p < 0.05, **p < 0.01. (B) changes in Fus1 KO and WT iKEC in response to Ionomycin. Panel I shows compartmentalization of Ca2+-sensitive fluorescent dye Rhod-2 (red) in iKE cells stained with mitochondria-specific dye MTG. Yellow color in the merged image represents staining of Rhod-2 in mitochondria. Panel II demonstrates snapshots showing Ionomycin-induced temporal changes of [Ca2+]m levels in WT and Fus1 KO iKEC double-stained with MTG/Rhod-2; Panel III shows [Ca2+]m dynamics profiles for WT and Fus1 KO iKEC obtained by double staining of iKEC with MTG/Rhod-2. Curves represent ratio of Rhod-2 fluorescence normalized to MTG fluorescence; Panel IV shows parameters of [Ca2+]m response induced by Ionomycin in WT and Fus1 KO iKEC: maximal amplitude of [Ca2+]m response (upper panel) and coefficient of [Ca2+]m decay phase after Ionomycin induction (lower panel).