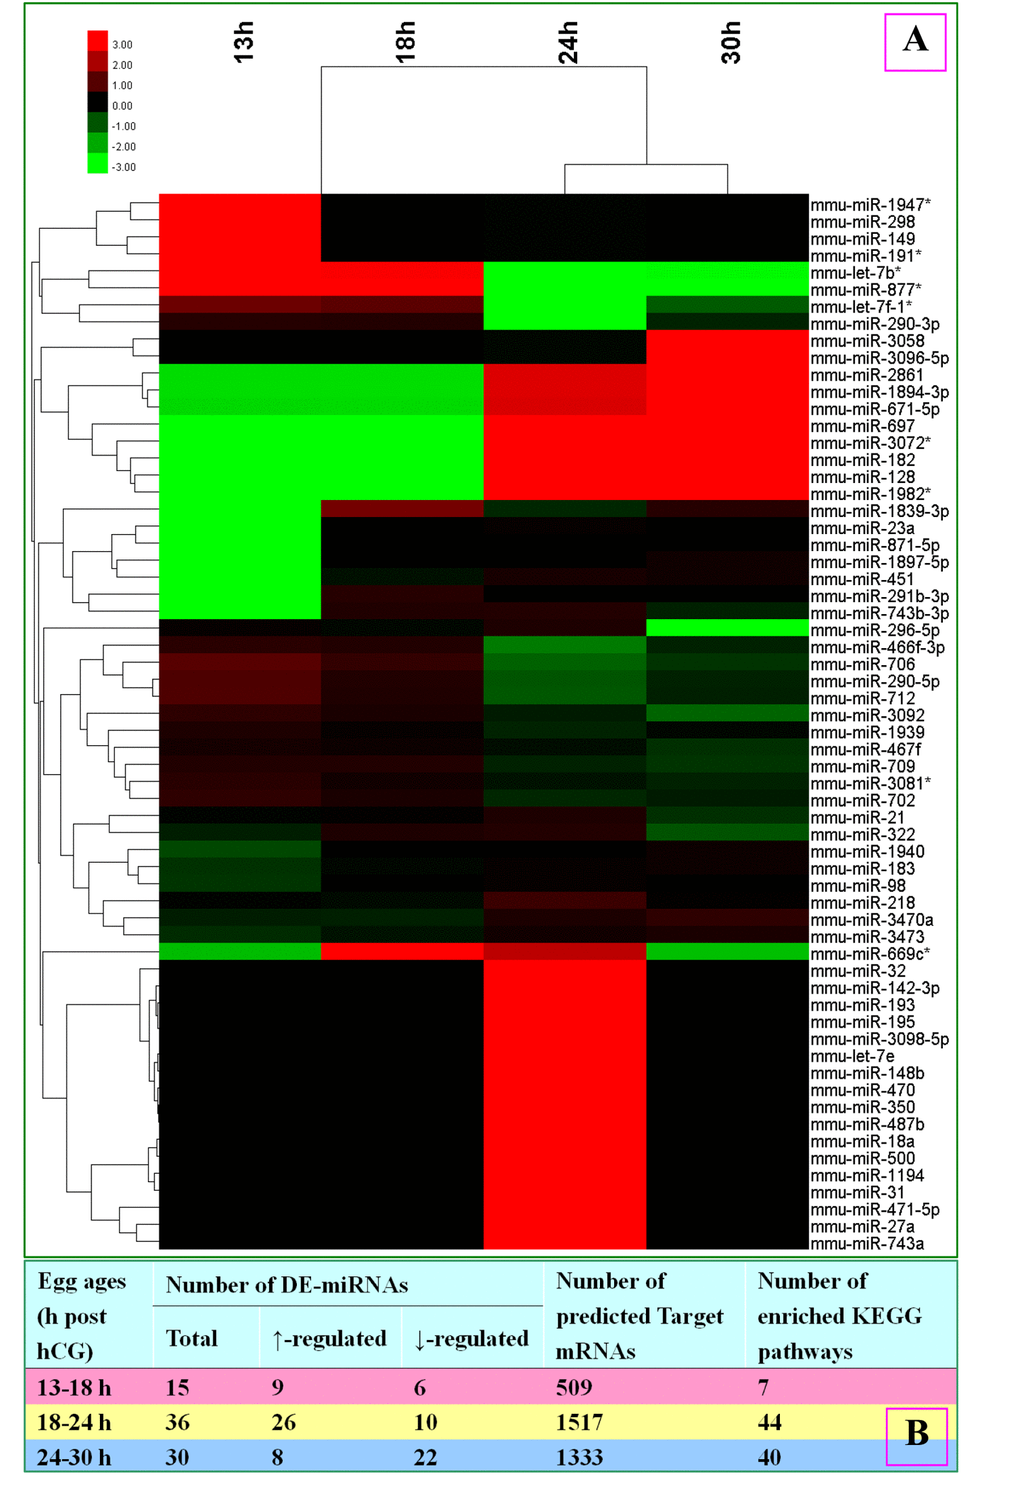
Figure 1.A microarray assay of miRNA expression profiles and a KEGG pathway enrichment analysis of target mRNAs predicted from differentially-expressed (DE) miRNAs in mouse oocytes aging for different times. (A) Heat map and cluster analysis of miRNA expression in oocytes aging for different times. Red indicates high relative expression and green indicates low relative expression. Fold changes greater than 2 (FC>2) were used as threshold for miRNA differential expression. (B) A table shows number of DE miRNAs, number of target mRNAs predicted from DE miRNAs and number of enriched KEGG pathways in oocytes aging for different times.