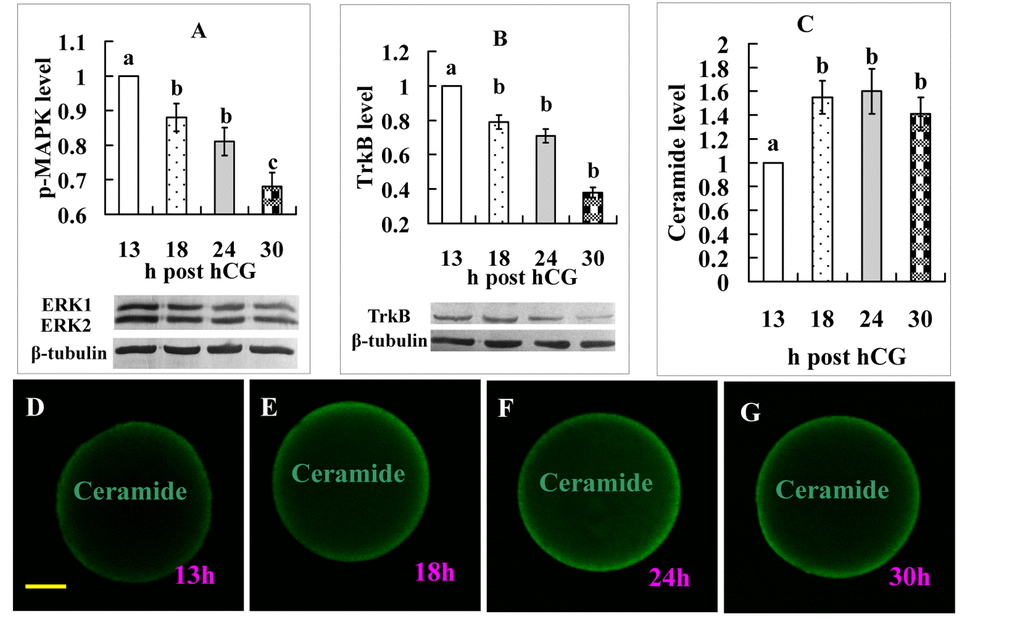
Figure 3.Levels of p-MAPK, TrkB, and ceramide expression in oocytes aging for different times. Graphs A, B and C show quantification of p-MAPK, TrkB, and ceramide expression, respectively. For ceramide quantification, the fluorescence intensity value in oocytes recovered at 13 h post hCG injection was set as one and the other values were expressed relative to this value. Each treatment was repeated 3-4 times and each replicate contained 35-40 oocytes. a-c: Values with a different letter above bars differ significantly (P < 0.05). D, E, F and G are micrographs from laser confocal images showing expression of ceramide in oocytes recovered at different times after hCG injection. Ceramide was colored green in the laser confocal images. The bar is 18 µm and applies to all images.