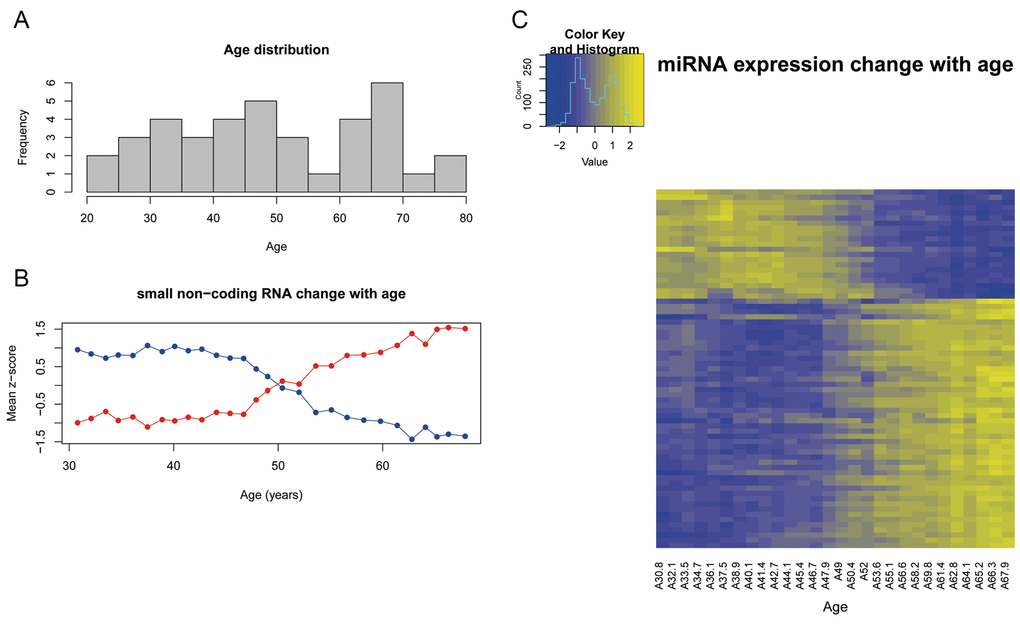
Figure 2.(A) Age distribution of subjects included in the study. (B) Expression of the sncRNA that progresively change with age according to the correlation analysis. y-axis represents the mean z-score values of the sncRNAs that correlate with age. Blue line represents the decreasing sncRNAs and red line represents the increasing sncRNAs. (C) Heatmap that represents the z-score value of the expression of the 69 sncRNAs correlated with age. Columns represent the mean age of the 28 sliding windows and rows are the 69 sncRNAs.