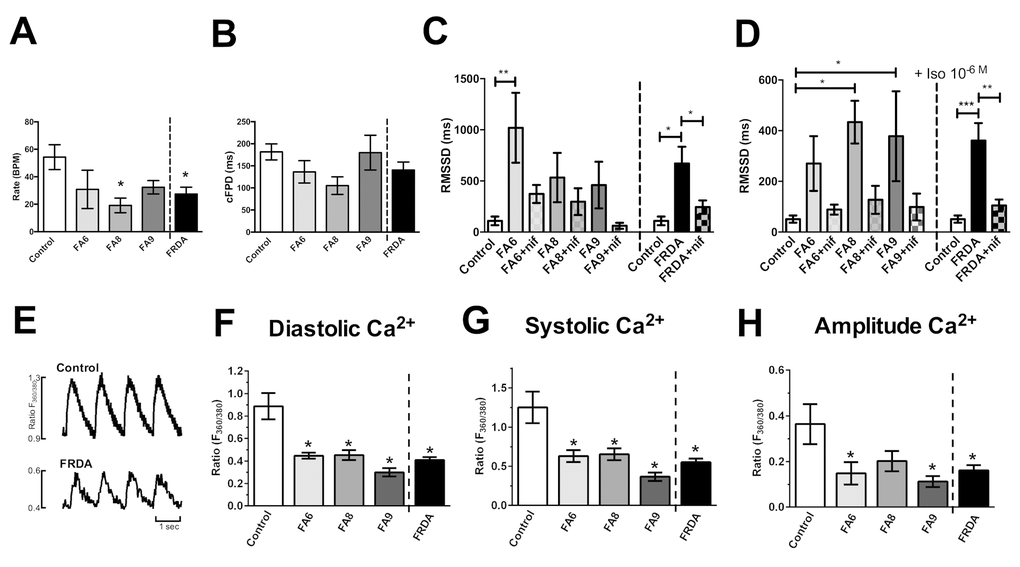
Figure 3.Assessment of phenotypes in FRDA iPSC-derived cardiomyocytes. (A) Beating rates (beats per minute, BPM), (B) corrected extracellular field potential durations (cFPD) and (C, D) the root of the mean of the sum of the square of the difference in the RR interval (RMSSD) (ms). Data shows RMSSD at basal (C) and 10-6M (D) isoprenaline ± nifedipine (NIF). (E) Representative Ca2+ transients. (F) Diastolic, (G) systolic and (H) amplitude Ca2+ in Control and FRDA- cardiomyocytes. (A-D) Data are mean ± SEM of combined values of 3 clones of each line (n=3 per line) and as a pool of all 3 clones of all FRDA lines (n=9 FRDA independent samples) and control cardiomyocytes (n=6). (F-H) Data are mean ± SEM of combined values of control cardiomyocytes (n=5), all 3 clones of each FRDA line (n=8-14 per line) and as a pool of all 3 clones of all FRDA lines (n=35 FRDA independent samples). Statistics: (A-D, F-H) One-way ANOVA followed by Bonferroni’s multiple comparison test, * p<0.05, **, p<0.01, ***, P<0.001.