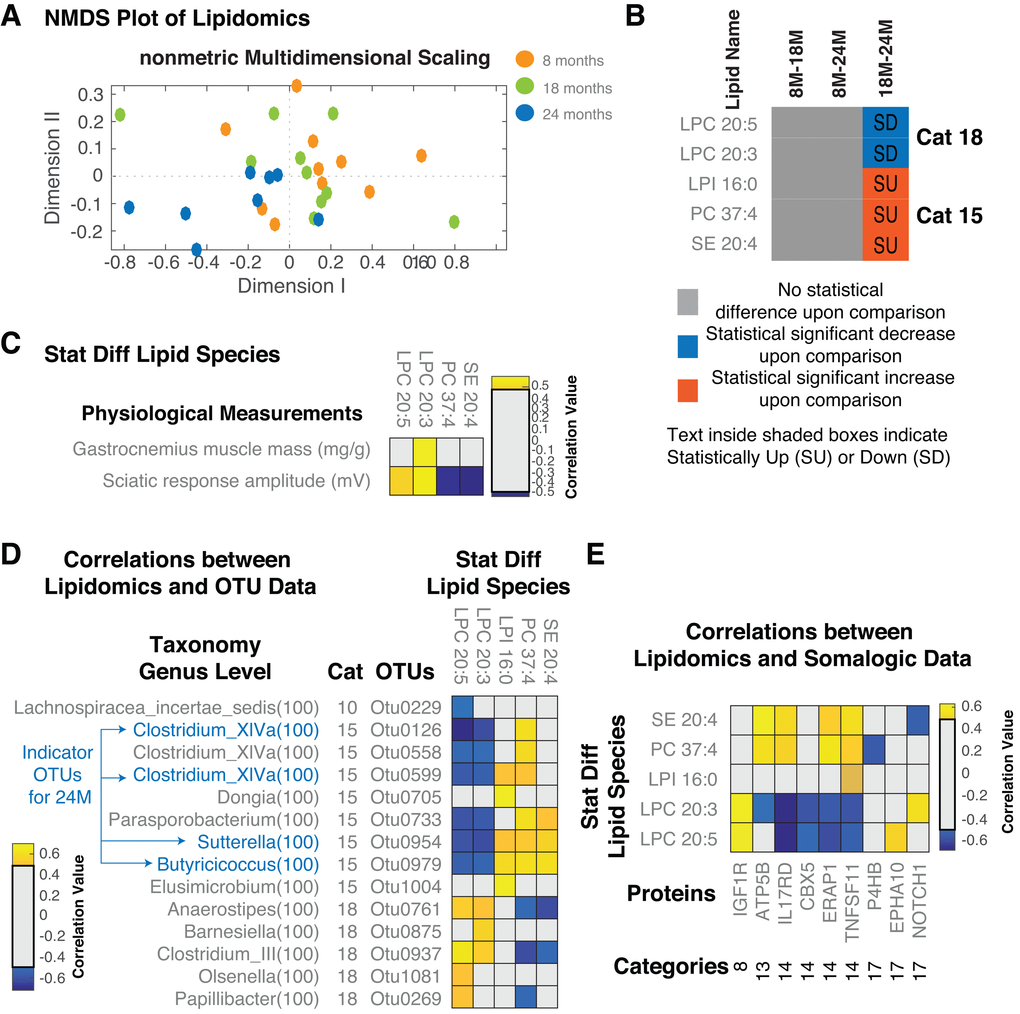
Figure 6.Serum Lipidomic analysis of aged rats. (A) NMDS plot of the lipid species measured across all the samples. Overall, we see a separation between 18M and 24M but not between 8M-18M and 8M-24M. (B) Statistically different lipid species and demarcation of up/downregulation in different comparisons. (C) Correlations between lipid species and measured physiological parameters. (D) Correlations between lipid species and OTUs. (E) Correlations between lipid species and proteins. Only statistically significant correlations are shown. Correlations shown are after FDR correction with Q values < 0.05. Abbreviations: SU – Statistically Up, SD – Statistically Down, Cat – Category, 8M – 8 months, 18M – 18 months and 24M – 24 months.