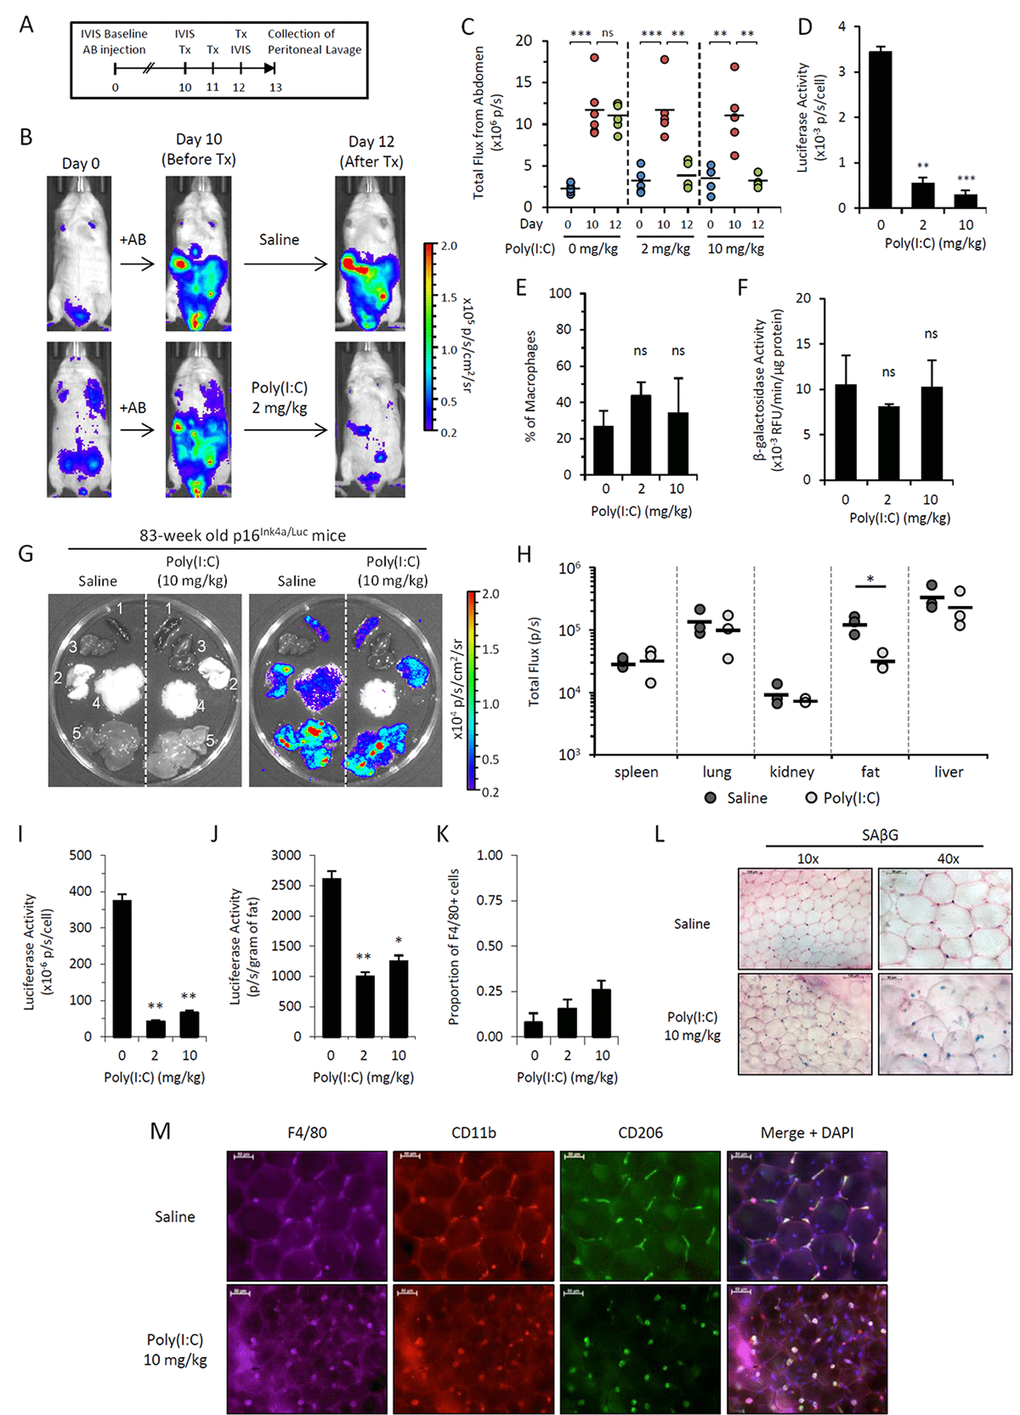
Figure 5.Poly(I:C) abrogates elevated p16Ink4a expression in two independent in vivo models. (A-F) p16Ink4a/Luc mice injected with alginate-encapsulated cells (AB injection) were treated with Poly(I:C) in saline at 0, 2 and 10 mg/kg for 3 consecutive days. (A) Schematic representation of alginate bead model experiment depicting timeline and procedures. (B) Representative serial images of mice depicting bioluminescence before and after treatment with 2 mg/kg Poly(I:C). Colored scale depicts relative luminescent signal intensity (in radiance) of minimum and maximum thresholds, as indicated. (C) Graphical representation of bioluminescence (total flux; p/s) measured from the abdomen of treated mice on day 0 (prior to AB injection; blue), day 10 (after AB injection, prior to treatment; red), and day 12 (6 hours after the final treatment; green). Geometric mean is depicted. Statistical significant is calculated with respect to differences between indicated days within treatment groups. (D-F) The effects of Poly(I:C) treatment were analyzed in peritoneal lavage collected within 24 hours of the final treatment of 0, 2, and 10 mg/kg Poly(I:C). Luciferase activity (D), the proportion of peritoneal macrophages (CD45+ CD11b+ CD170- F4/80+ cells) to total lavage cells as quantitated via flow cytometry (E) and β-galactosidase activity (measured via 4-MUG hydrolysis) (F) were quantitated from peritoneal lavage cells. Results are representative of two independent experiments (n=3-6 mice per group per experiment). Statistical significance compared to vehicle-treated controls is depicted; ns, not significant; **, p-value < 0.01; *** p-value < 0.001. (G-M) Chronologically aged mice (83-week old females) were treated with saline or Poly(I:C) (10 mg/kg) for 3 consecutive days. Organs were collected from mice the following day for quantitation of luciferase signal via IVIS. (G) Representative gray-scaled images of organs (1, spleen; 2, lungs; 3, kidneys; 4, perigonadal visceral fat; 5, liver) visualized on IVIS (left) with bioluminescence overlay in color (right). (H) Graphical representation of bioluminescence (total flux; p/s) quantitated from individual organs. Results are representative of two independent experiments (n=3 mice per group per experiment). *, p-value < 0.05. (I-K) Visceral perigonadal adipose tissue was pooled within groups, and the stromal vascular fraction was isolated for analysis. Luciferase activity per cell (I) was measured via luminometer, and the total signal per gram of fat (J) was calculated. (K) The proportion of cells in the SVF expressing macrophage marker F4/80 was measured by detection of immunofluorescent staining via cytometer. (L&M) Microphotographs of whole adipose tissue from mice with or without Poly(I:C) treatment (10 mg/kg) stained for SAβG activity via X-Gal reagent (blue; nuclear fast red counterstain) (L) and immunofluorescent staining of macrophage markers F4/80 (purple), CD11b (red), CD206 (green) and merged overlay with DAPI nuclear counterstain (blue) (M). Results are representative of two independent experiments.