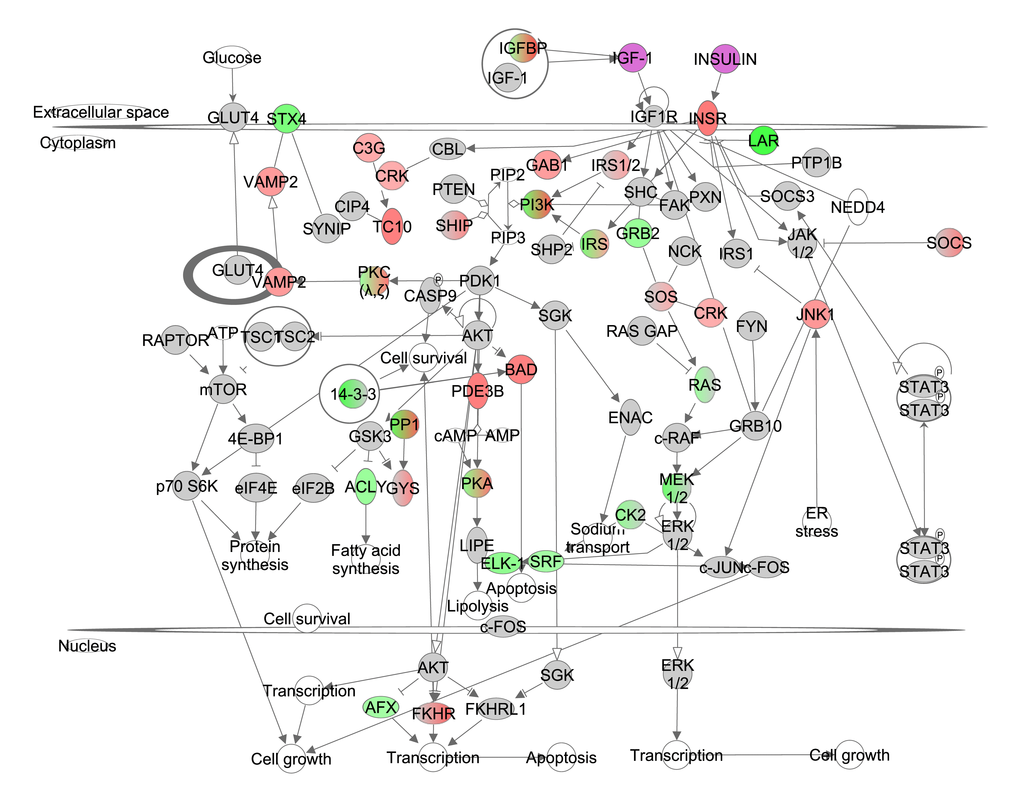
Figure 1.The insulin like growth factor (IGF-1)/insulin pathway created in the Ingenuity Pathway Analysis (IPA, www.qiagen.com/ingenuity) program. The normalized counts for each gene were correlated with the increase in calorie restriction (CR) level by Pearson correlation method. The pathway is colored based on a cut-off of an absolute correlation coefficient higher than 0.3.. Red indicates a positive correlation with increasing CR level while green indicates a negative correlation. Circulating levels of insulin and IGF-1 were significantly reduced in these CR mice [15] and this is indicated by a purple color.