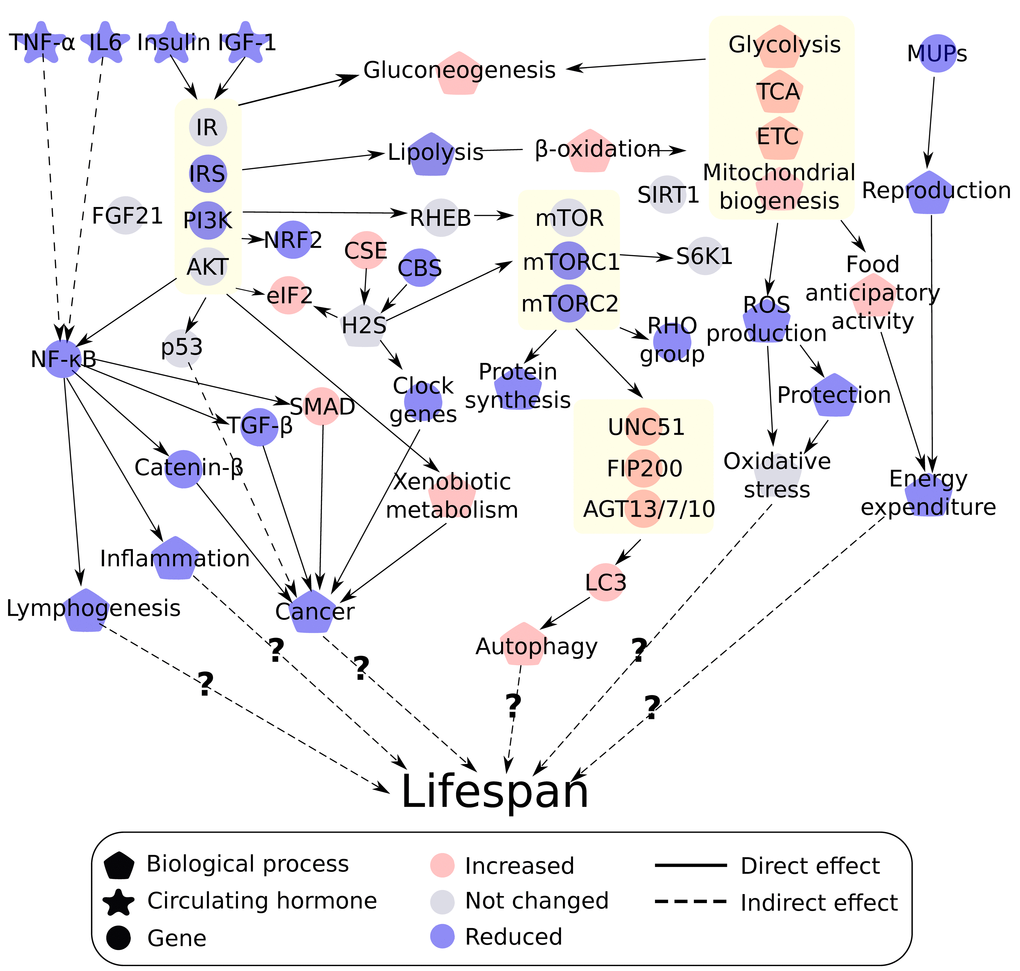
Figure 14.Integrated overview of the different theories of ageing affected by graded calorie restriction (CR). Red indicates a positive correlation with increasing CR while blue indicates a negative correlation. Grey indicates no linear changes with the increase in CR level. Genes or processes biologically related are grouped together indicated by a yellow box including the insulin/insulin like growth factor (IGF-1) signaling pathway, mechanistic target of rapamycin (mTOR) pathway, fuel utilization and autophagy.