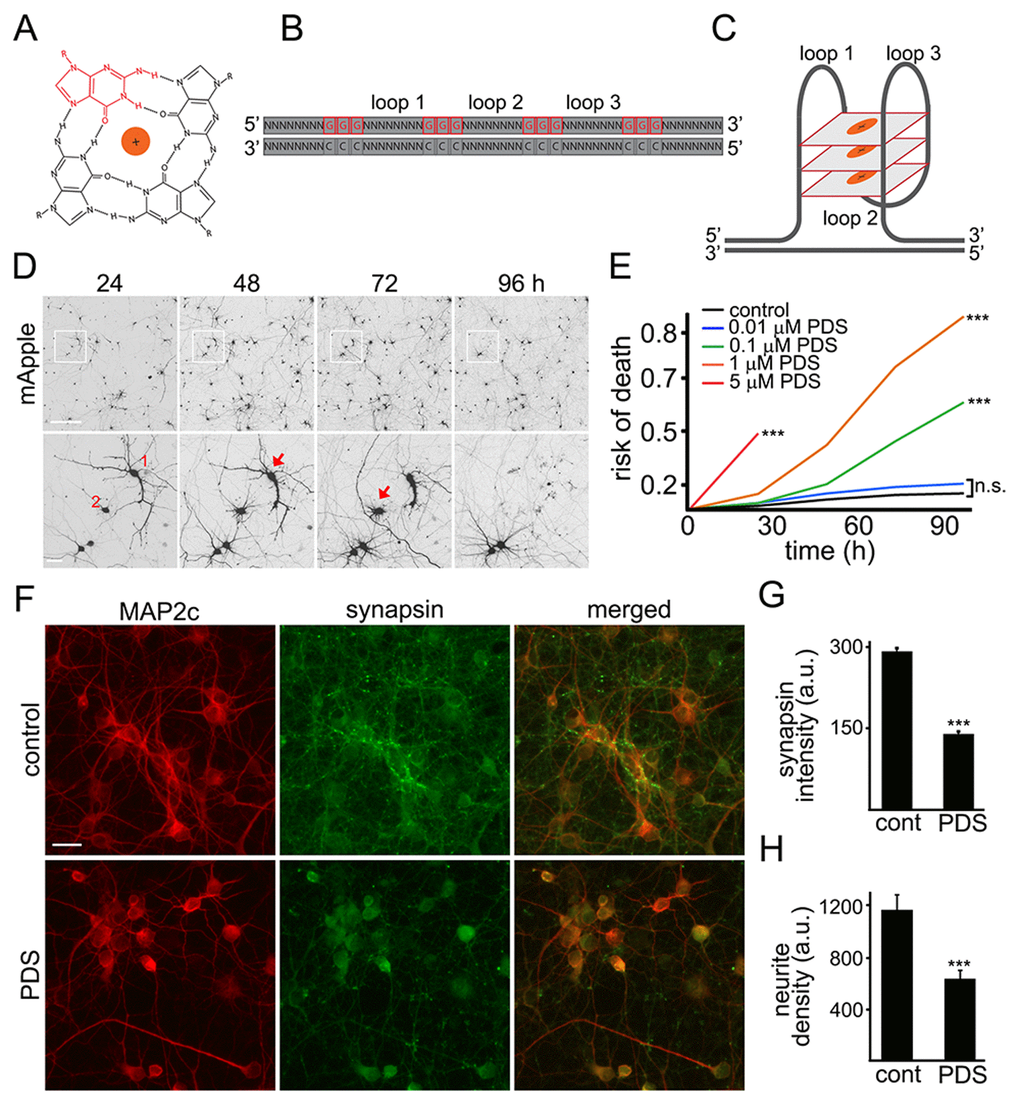
Figure 1.Pyridostatin is neurotoxic for primary cortical neurons. (A) G-quadruplex is a non-canonical DNA secondary structure. Four guanine molecules (a single guanine is in red) can assemble into a square planar structure. The structure of a G-quadruplex is stabilized by hydrogen bonds between guanines and the interactions with a monovalent cation (Na+ or K+) resided in the central channel. (B) Repetitive guanine-rich DNA or RNA sequences have the potential to form G-quadruplex structures (C). (D) An example of survival analysis. Primary cortical neurons were transfected with mApple (a morphology and viability marker) and tracked with an automated microscope. Images collected every 24 h demonstrate the ability to return to the same field of neurons and to follow them over time. Each image is a montage of non-overlapping images captured in one well of a 24-well plate. Scale bar is 100 μm. A region from the original images at different time points is zoomed in to demonstrate longitudinal single-cell tracking (bottom panel). Red arrows depict two neurons that degenerate before 96 h after transfection. Note that neurites of the neuron 1 retract overtime. Scale bar is 20 μm. (E) Primary cortical neurons were transfected with mApple and treated with a vehicle or with different concentrations of pyridostatin (PDS; 0.01–5 μM). Transfected neurons were tracked with an automated microscope. Risk of death curves demonstrate that pyridostatin is neurotoxic. ***p<0.0001 (log-rank test). N.s., non-significant. Three hundred neurons were analyzed from three independent experiments. (F) Primary cortical neurons were treated with a vehicle (upper panel, control) or with 1 μM pyridostatin overnight (lower panel; PDS), fixed and stained with antibodies against MAP2c (red) and synapsin (green). Scale bar is 10 μm. (G) Quantification of the synapsin fluorescence intensity from (F). ***p<0.0001 (t-test). (H) Quantification of the neurite density from (F). MAP2c staining was used by the algorithm to identify and analyze neurites. ***p<0.001 (t-test). Three hundred neurons were analyzed from two independent experiments.