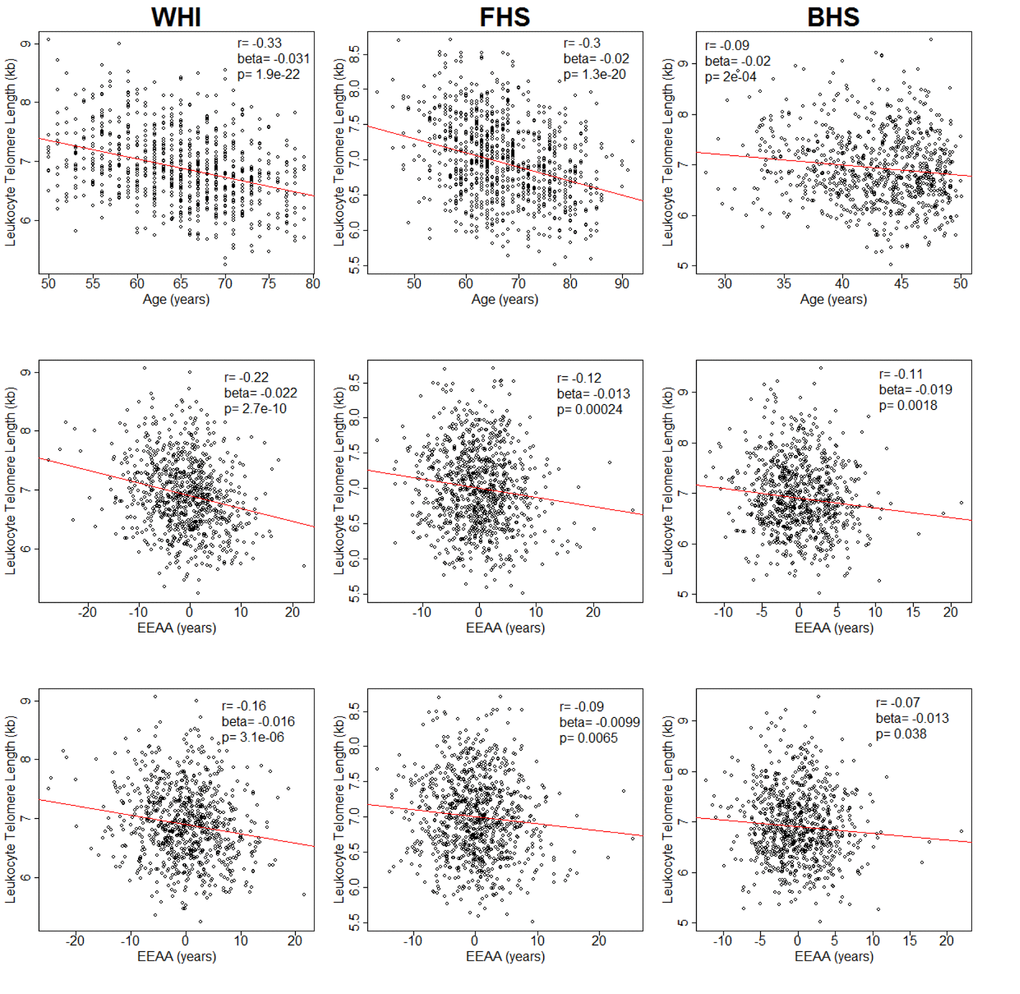
Figure 1.Plots of leukocyte telomere length (LTL) against chronological age (upper row) and extrinsic epigenetic age acceleration (EEAA) (second and third rows). Second row displays unadjusted EEAA. Third row displays EEAA adjusted for BMI, sex, race/ethnicity, and current smoking status. First column displays associations for the Women's Health Initiative (WHI, n=804). Second column displays associations for the Framingham Heart Study (FHS, n=909). Third column displays associations for the Bogalusa Heart Study (BHS, n=826).