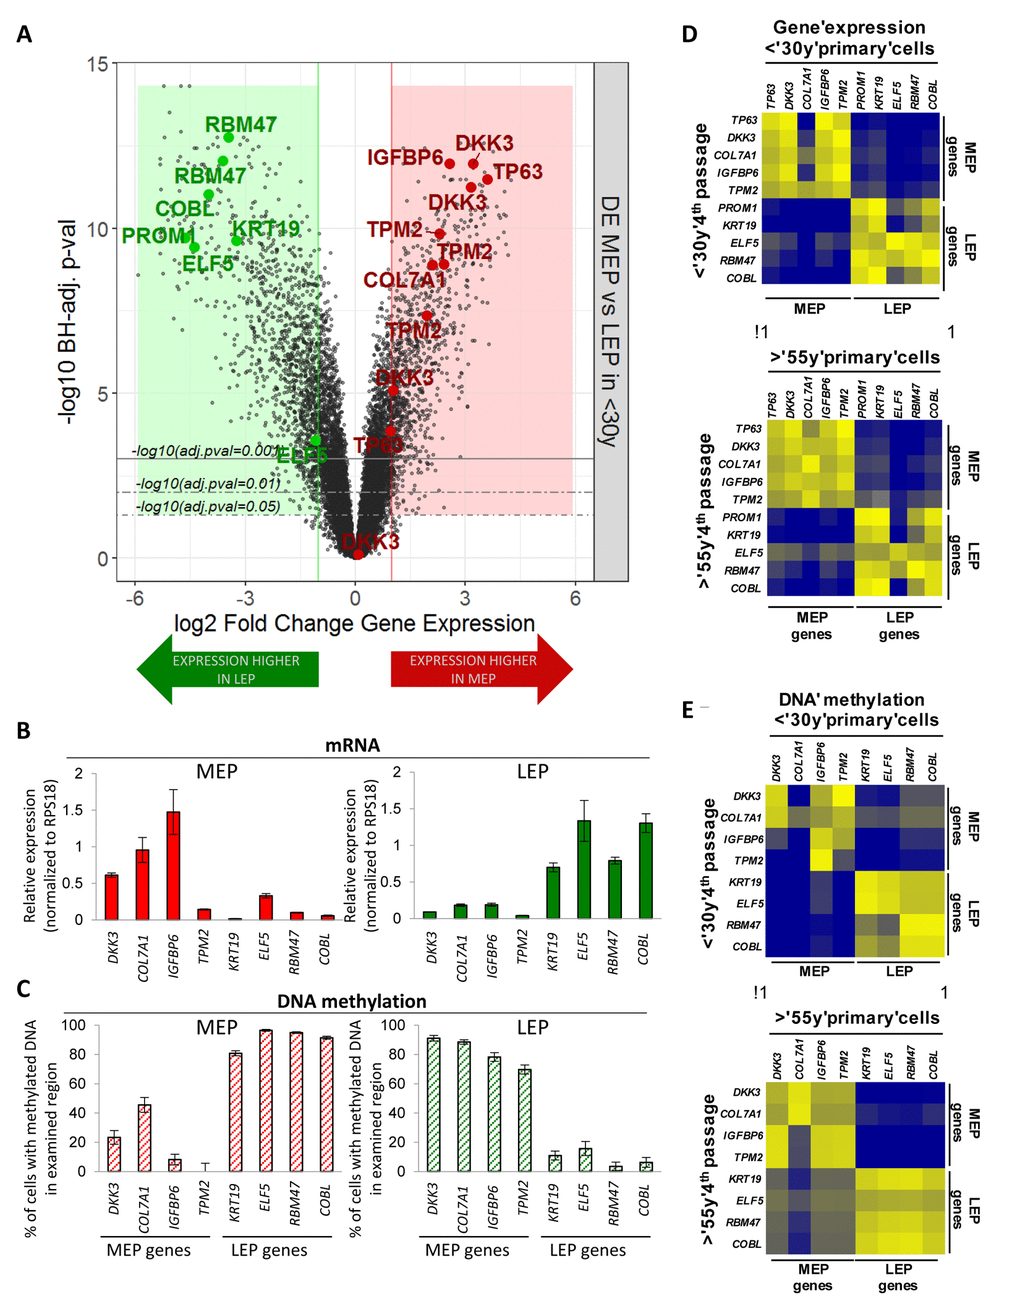
Figure 1.Lineage-specific gene expression and promoter methylation is consistent between HMEC in vivo and pre-stasis cultures. (A) Volcano plot based on differential expression (DE) analysis of 24,965 Illumina gene probes (19,499 mapped genes) in 4p MEP and LEP from <30y subjects by beadchip expression array. Y-axis indicates –log10 Benjamini-Hochberg (BH)-adjusted p-values from significance analysis and x-axis shows log2 fold change (LFC) in gene expression. Colored regions and lines highlight fraction of genes which show lineage-specific differential expression (absolute log2 fold change ≥ 1 and BH adj. p-val < 0.05, < 0.01, < 0.001) with negative LFC values (green area) indicating higher expression in LEP and positive LFC values (red area) higher expression in MEP. LEP-specific (green circle) and MEP-specific (red circle) genes used as lineage-specific probesets are annotated (19 Illumina gene probes). Validation of lineage specific (B) gene expression in and (C) corresponding promoter DNA methylation in FACS enriched MEP and LEP, using qPCR-based lineage gene probe sets. Lineage specific expression was inversely correlated with DNA methylation status in the promoter. Differential expression and methylation in each gene were significant (p < 0.01). Expression data was normalized to expression of RPS18. Data were shown by mean ± SEM. Correlation of (D) Lineage-specific gene expression and (E) promoter DNA methylation status in MEP and LEP between 4p HMEC strains and uncultured cells dissociated from organoids. Pearson’s correlation value of Gene expression and DNA methylation between organoids and 4th passage HMECs were 0.9670 and 0.9333, respectively.