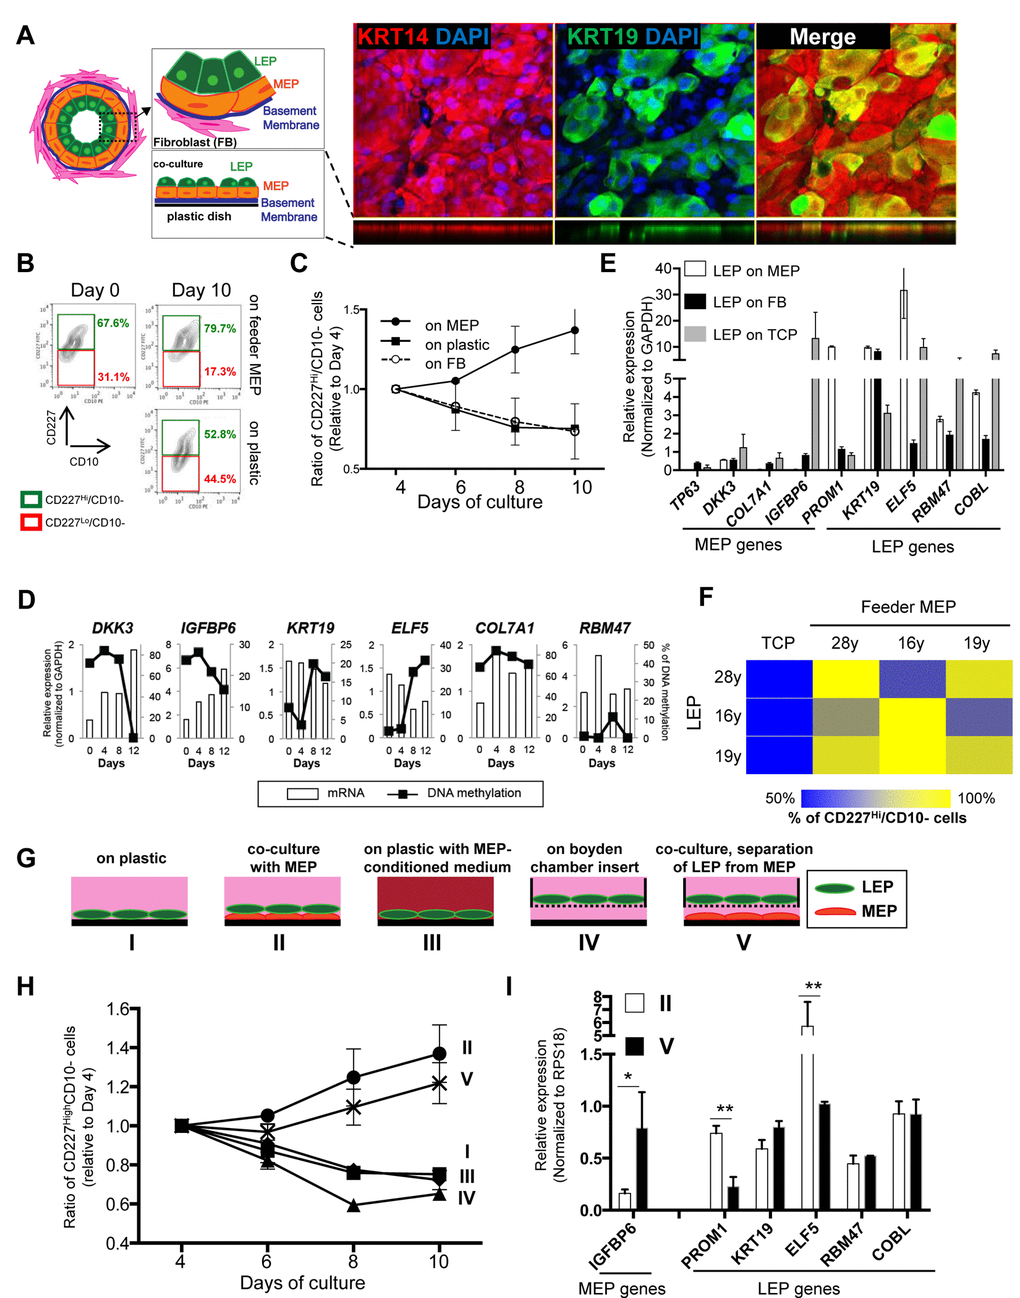
Figure 2.Apical surfaces of myoepithelial cells provide a robust microenvironment for maintenance of the luminal lineage. (A) Schematic model of human mammary glands, co-culture and immunofluorescent staining in co-culture. Six days co-culture of LEP with MEP from 19y old were stained with antibodies against KRT14 (red) and KRT19 (green). Nuclei were stained with DAPI (blue). Orthogonal views were shown below each image. (B) Contour plots of CD10 and CD227 expression, as measured by FACS, comparing luminal cell populations on tissue culture plastic or co-cultured on a layer of MEP. LEP populations were maintained better after 10 days in co-culture (78.7%) compared to (52.8%). (C) Line graphs showing the relative proportion of CD227+ LEP over time in co-culture with isogenic MEP or isogenic fibroblast (FB) feeders, or on plastic. (n=3) (D) Gene expression in LEP (white bars) and promoter methylation (black line) over 12 days of culture on TCP. LEP genes tend to be reduced with increasing methylation, whereas MEP gene expression is increased with reduced methylation. (E) Bar graphs showing differences in LEP- and MEP-specific gene expression in LEP cultured on FB feeders (black), TCP (gray) or on MEP feeders (white). Mean ±SD, normalized to expression of GAPDH (n=3). LEP gene expression is not maintained on FB feeders nor on plastic. (F) Heatmap showing the proportion of LEP, measured with FACS, remaining after 10 days co-culture with different combinations of MEP feeders from women <30y. (G) Schematic outlines that represent conditions I-V. (H) Line graphs showing proportion of LEP that is maintained over 10 days cultured in conditions (I-V). (n=3) (I) Bar graphs showing expression of lineage specific genes in LEP cultured 10 days in conditions II and V. Condition II was the only one to maintain a complete LEP phenotype over time. Mean ±SD, normalized to expression of RPS18 (n=3). * and ** showed statistical significances at p<0.05 and p<0.01, respectively.