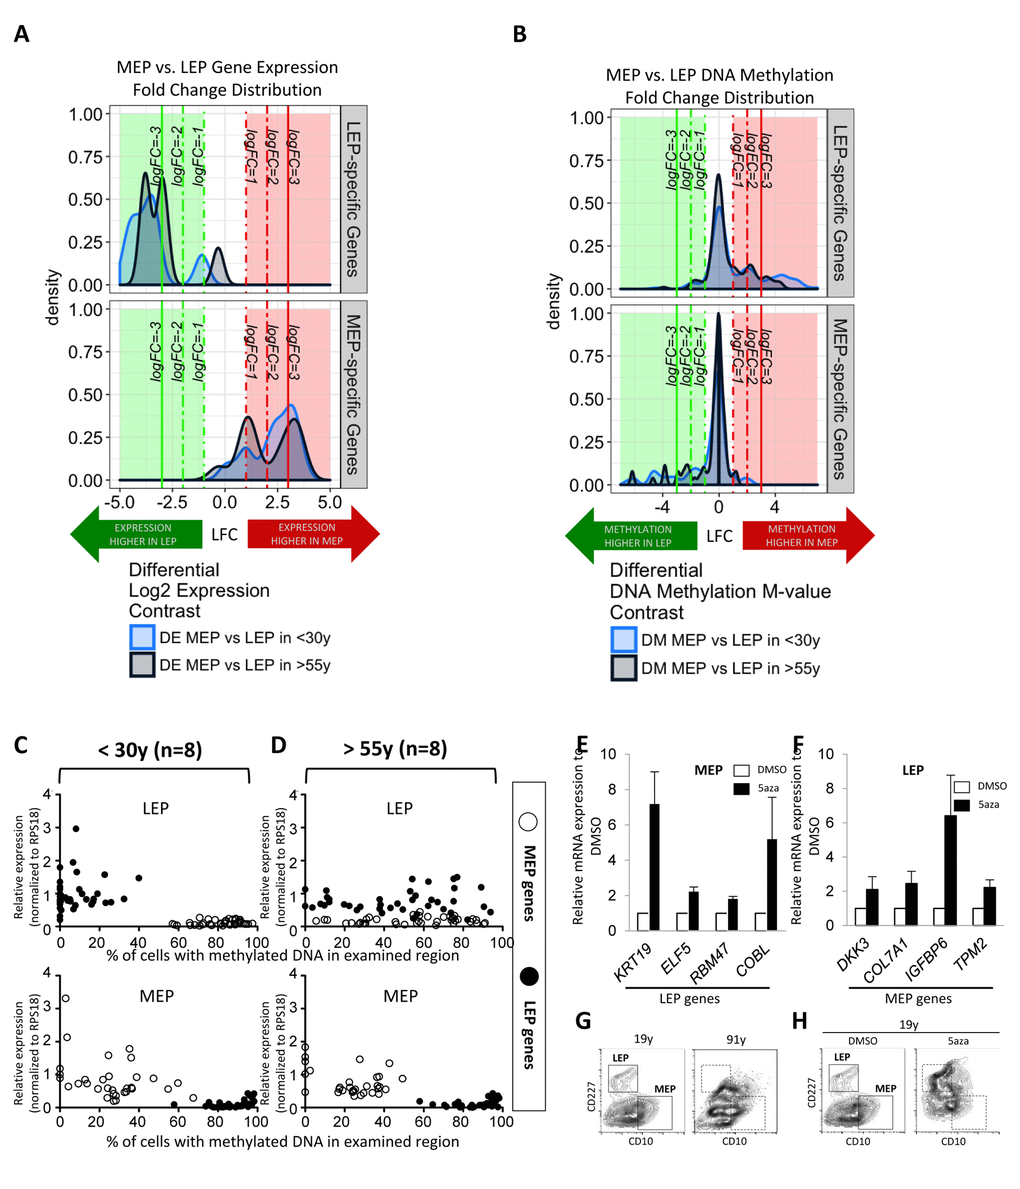
Figure 3.Age-dependent gene expression in luminal cells is associated with specific DNA methylation patterns. LEP- and MEP-specific probe sets were used to identify age-dependent changes in lineage-specific gene expression and DNA methylation patterns in FACS enriched 4p LEP and MEP. Corresponding expression of probeset genes in LEP and MEP cells from 9 different 4p HMEC strains representing <30y and >55y age groups in Illumina HumanHT-12 v4 BeadChips (Set1) were assayed for lineage-specific differential expression (DE) between MEP and LEP across 19 Illumina gene probes (A). Infinium 450K methylation arrays were then used to evaluate lineage-specific differential methylation (DM) based on methylation M-values of probeset genes across 247 CpG sites for the same subjects (B). Kernel Density Estimates (KDE) of distributions of log2 fold changes (LFC) in expression (A) or DNA methylation (B) between MEP vs. LEP in <30y (light blue) and >55y (dark blue) subjects for LEP-specific genes (top panel) and MEP-specific (bottom panel) are shown. Colored regions and lines highlight fraction of genes or CpG sites which show lineage-specific differential expression or methylation respectively (≥ 1-, ≥ 2-, ≥ 3- absolute LFC and Benjamini-Hochberg, BH, adj. p-val < 0.05, < 0.01, < 0.001), with negative LFC values (green area) indicating higher expression/methylation in LEP and positive LFC values (red area) higher expression/methylation in MEP. (C and D) Dysregulation of lineage specific gene expression with age in LEP was associated with age-dependent DNA methylation patterns. The relationship between expression and methylation of lineage-specific genes in FACS enriched LEP and MEP from women (C) <30y or (D) >55y, is visualized using dot plots. LEP probes are shown as filled circles, MEP probes are shown as open circles. A change in the lineage-specific relationship was most prominent in older LEP. Eight strains were used for each age group, expression data were normalized to expression of RPS18. Bar graphs showing expression of (E) LEP genes in MEP treated with 5’aza, and (F) MEP genes in LEP treated with 5’aza, showing that these lineage specific genes were regulated in part by DNA methylation. (G) Contour plots representing CD10 and CD227 expression measured by FACS on HMEC from a 19y and a 91y woman, which are representative of the phenotypes typically observed in these extreme age groups. Corresponding areas were shown with dotted line boxes. (H) CD10 and CD227 expression in HMEC from a 19y woman treated with DMSO or DMSO+5’aza at 15 μM for 48h. Young HMEC phenocopied older HMEC following 5aza treatment. Gates used to delineate lineages are indicated with boxes.