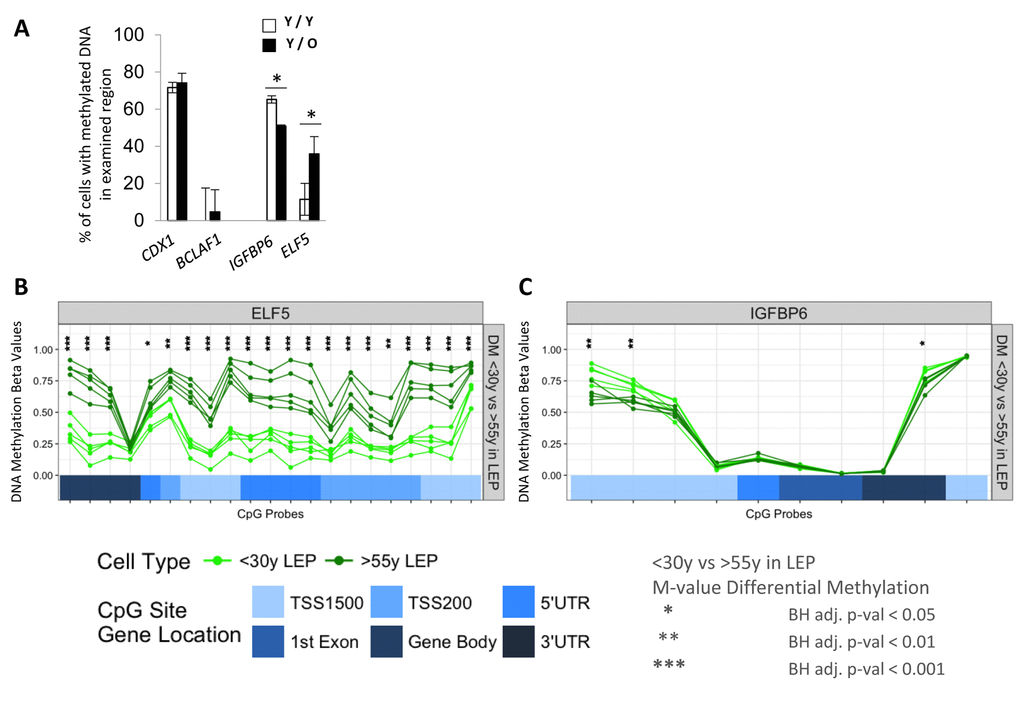
Figure 6.Age of the apical microenvironment is a determinant of ELF5 and IGFBP6 promoter DNA methylation states. (A) Bar graphs showing the percent of IGFBP6 and ELF5 methylated promoter DNA in LEP after 10 days of culture on young (white) or old (black) MEP feeders. CDX1 and BCLAF1 are hyper- and hypomethylated gene controls. Data are presented as mean ±SD (n=3). * indicates statistical significances at p<0.05. DNA methylation analyses of (B) ELF5 and (C) in IGFBP6 using Infinium 450K methylation arrays. Analysis assessed percentage methylation (beta-values) and age-specific differential methylation (DM) across CpG sites in these genes for <30y LEP (green) and >55y LEP (dark green). DNA methylation beta-values across CpG sites are plotted in order of their chromosomal mapping, and range from 0-1 denoting hypo- (β-val < 0.25), hemi- (0.25 < β-val < 0.75) and hyper-methylated (β-val > 0.75) methylation levels. Corresponding annotated locations of CpG sites respective to gene regions: TSS1500, TSS200, 5’UTR, 1st Exon, Gene Body and 3’UTR (shades of blue) are shown in tracks below. Significance of age-specific differential methylation based on corresponding M-values between <30y and >55y LEP are denoted by asterisks: Benjamini-Hochberg, BH-, adj. p-val (*) < 0.05, (**) < 0.01, (***) < 0.001.