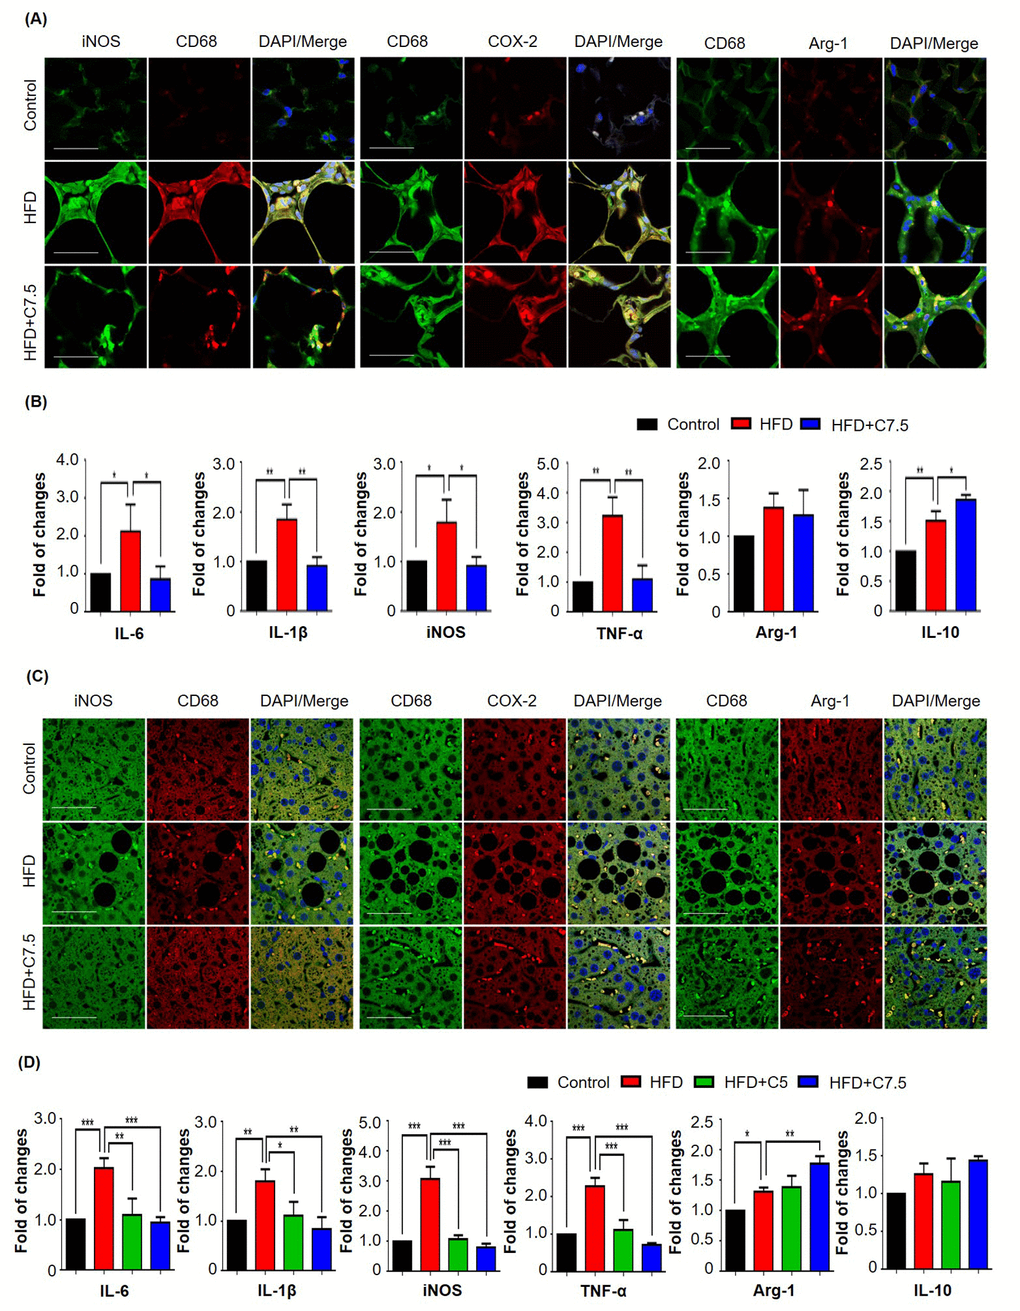
Figure 2.Celastrol differentially affected the expression of macrophage M1 and M2 biomarkers in epididymal adipose tissues and liver. (A) Detection of iNOS, COX-2, and arginase-1 in epididymal adipose tissues. After 21-day treatment, epididymal fat pads were recovered from mice, and stained with specific antibodies. CD68 was stained as pan-macrophage biomarker whereas the cell nuclei were stained with DAPI. The sections were imaged under a Zeiss LSM 780 confocal microscopy. Representative images were shown. Scale bar, 50 μm. (B) qRT-PCR quantification of macrophage M1 and M2 biomarkers in epididymal adipose tissues. Total RNAs were extracted from adipose tissues and analyzed by qRT-PCR technique using QuantiTect SYBR Green PCR Kit and specific DNA primers from Qiagen. N = 3; HFD, HFD only; C7.5, celastrol (7.5 mg/kg/d). (C) Detection of iNOS, COX-2, and arginase-1 in liver tissues. Livers were recovered from mice, and stained with specific antibodies. CD68 was stained as pan-macrophage biomarker whereas the cell nuclei were stained with DAPI. The sections were imaged under a Zeiss LSM 780 confocal microscopy. Representative images were shown. Scale bar, 50 μm. (D) qRT-PCR quantification of macrophage M1 and M2 biomarkers in liver tissues. Total RNAs were extracted from livers and analyzed by qRT-PCR technique using QuantiTect SYBR Green PCR Kit and specific DNA primers from Qiagen company. N = 3; HFD, HFD only; C5, celastrol (5 mg/kg/d); C7.5, celastrol (7.5 mg/kg/d); *, p < 0.05; **, p < 0.01; ***, p < 0.001.