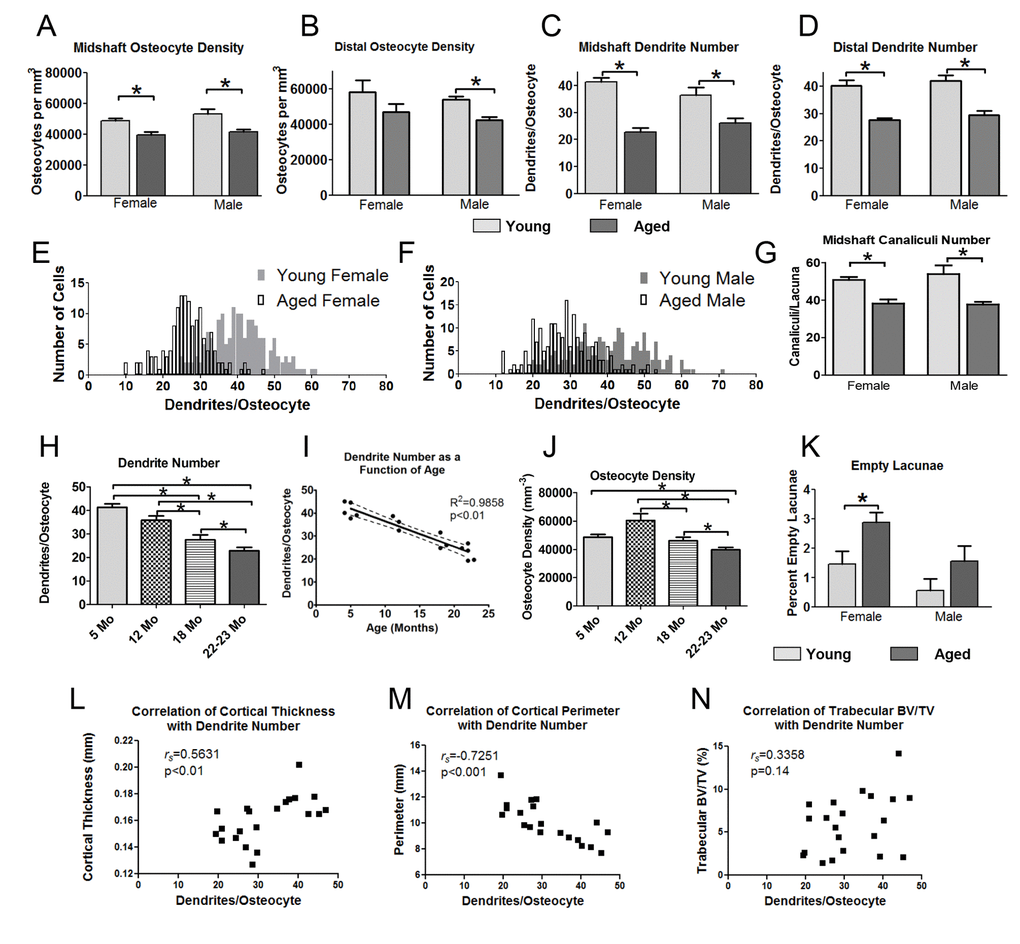
Figure 4.Aging is associated with reduced osteocyte dendrite connectivity, which precedes a decline in osteocyte number. Quantitation of osteocyte density (A, B) and dendrite number per osteocyte (C, D) in the midshaft and distal femur from phalloidin stained sections in young and aged mice. (E, F) show frequency distribution plots of the number of dendrites per osteocyte in young and aged female (E) and male (F) mice. (G) Quantitation of the number of canaliculi per lacuna from Texas Red-dextran labeled midshaft femur sections in young and aged mice. (H) Time course showing a decline in dendrite number per osteocyte in female mice over 5, 12, 18 and 22mo. (I) Regression plot showing the linear decline in osteocyte dendrite number between 5 and 22mo in female mice. (J) Time course showing changes in osteocyte density in female mice at 5, 12, 18 and 22 mo. (K) Quantitation of empty lacunae in young and aged mouse femurs. (L-N) Scatterplots of osteocyte dendrite number versus cortical thickness (L), cortical perimeter (M) and trabecular BV/TV (N) with Spearman’s correlation coefficient and significance indicated. (Data are mean ± SEM, * = p< 0.05, ANOVA/Tukey’s) (A-D and K), females n=5, males n=6; G, n=5; (H, J, n= 3-5).