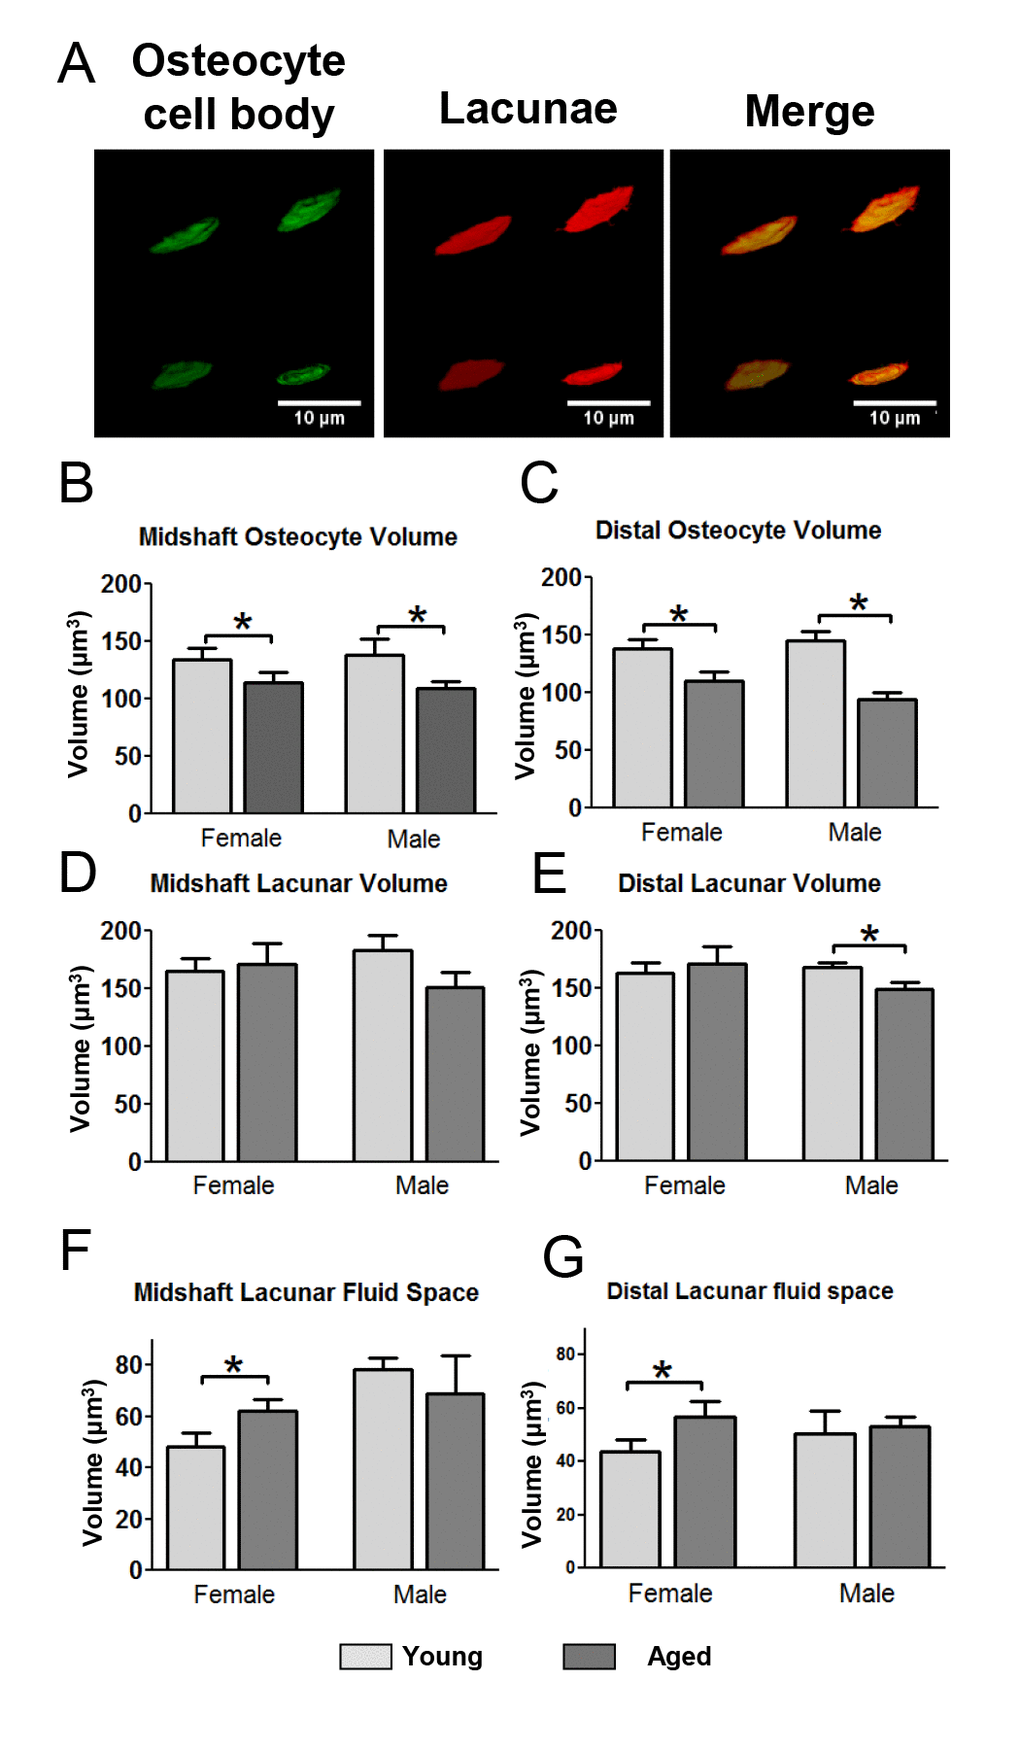
Figure 5.Decreased osteocyte cell volume with decreased lacunar volume in aged males but not females leads to gender differences in lacunar fluid volumes. (A) Examples of 3D renderings of the osteocyte cell bodies labeled with DiO and lacunae labeled with fixable Tx-Red-dextran for volumetric calculations. (B and C) quantitation of osteocyte cell body volume in the midshaft (B) and distal (C) region. (D and E) quantitation of the corresponding lacunar volumes. (F and G) show calculation of the lacunar fluid space derived from subtracting the osteocyte cell body volume from its corresponding lacunar volume. (Data are mean ± SEM, * = p< 0.05, ANOVA/Tukey’s; n= 5).