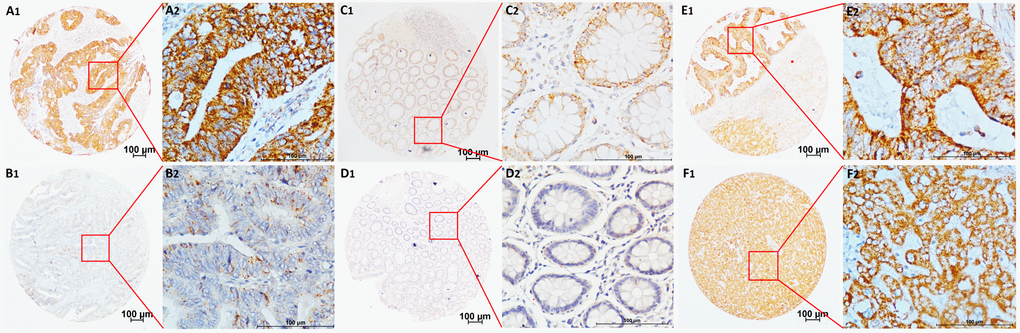
Figure 3.Representative TMA-IHC staining of CNPY2 isoform2 protein. (A1, A2) Colon adenocarcinoma with high CNPY2 isoform2 expression in the cytoplasm of CRC cells and some expression in the extracellular matrix; (B1, B2) Colon adenocarcinoma with low CNPY2 isoform2 staining in the cytoplasm of CRC cells; (C1, C2) Tumor-adjacent normal tissues with positive staining of CNPY2 isoform2; (D1, D2) Tumor-adjacent normal tissues with negative staining of CNPY2 isoform2. (E1, E2) High CNPY2 isoform2 expression in liver metastatic tumor tissues; (F1, F2) High CNPY2 isoform2 expression in normal liver tissues. Original magnification was 40×with 100 μm scale per in A1, B1, C1, D1, E1, and F1; 400× with 100 μm scale per bar in A2, B2, C2, D2, E2, and F2.