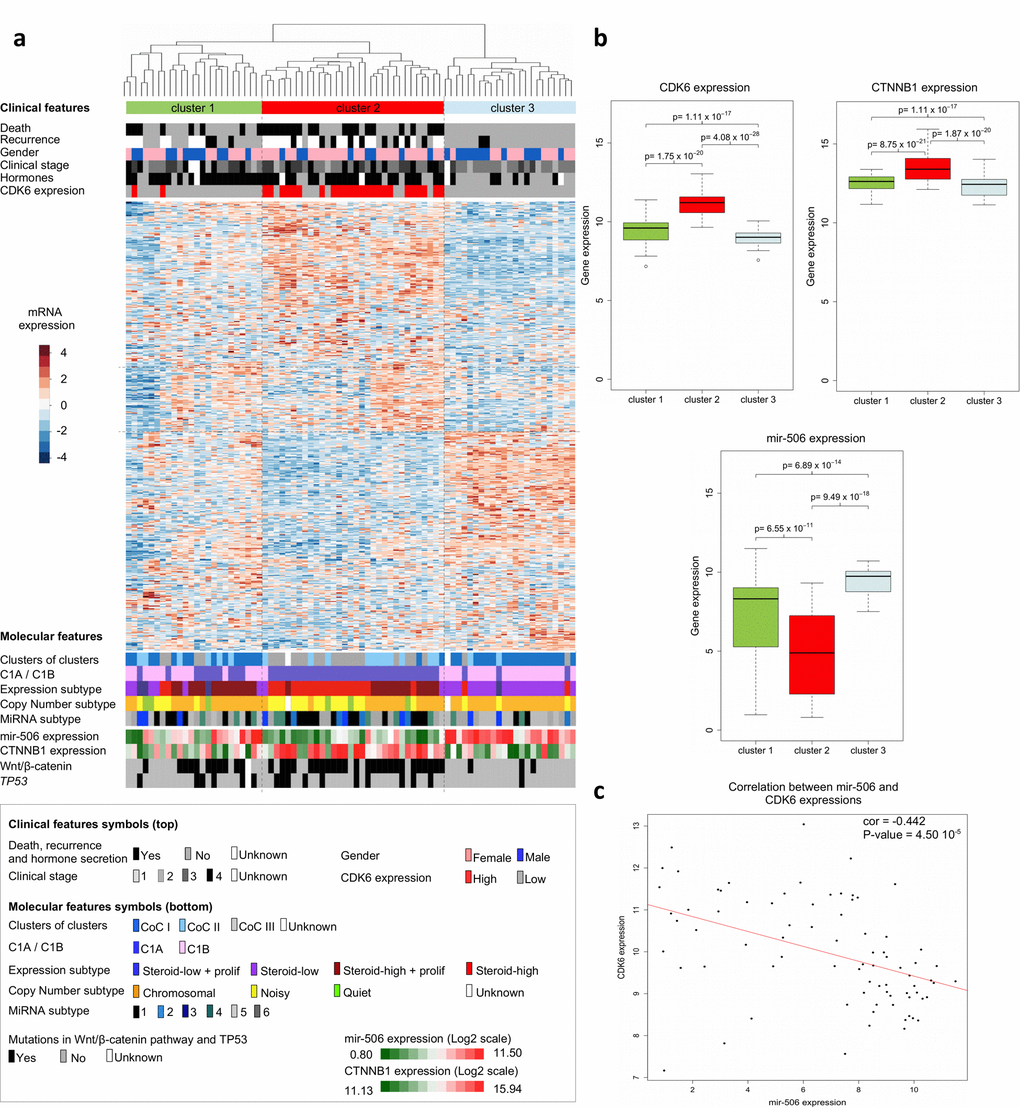
Figure 2.Clinical and molecular features of adrenocortical carcinomas. (a) Hierarchical clustering of the 79 ACC samples results into clusters 1, 2 and 3, as indicated in color bars at the top of the heatmap. Clustering is based on the expression levels of the top 500 most variant genes from the transcriptomes of the 79 ACCs. Dissimilarities between samples are indicated by the dendrogram at the top of the heatmap. Expression levels are shown by colors. Colors follow the base-2 log color scale at the left of the heatmap. The color symbols for clinical and molecular features are indicated in the frame at the bottom of the heatmap. (b) Box-plots showing the distribution of the CDK6, CTNNB1 and MIR506 gene expression values of tumor samples in the three transcriptome-based clusters. A base-2 log scale is used for the Y-axis showing gene expression. The band at the middle of the box indicates the median value. The bottom and top of the box are the 25th and 75th percentiles. Bottom and top whiskers represent the limits of exclusion of outliers. p values show the significance of the unilateral Wilcoxon-Mann-Whitney test. (c) Scatter plot showing the expression values of CDK6 and MIR506 of ACC samples, for which a base-2 log scale is used. The value of the Pearson coefficient (cor.) and the Pearson test p value for correlation are indicated at the top-right of the scatter plot. The red line is the linear regression line illustrating the negative correlation of expression between CDK6 and MIR506. Clinical and molecular features (with the exception of the CDK6 expression group) were previously described [9,11].