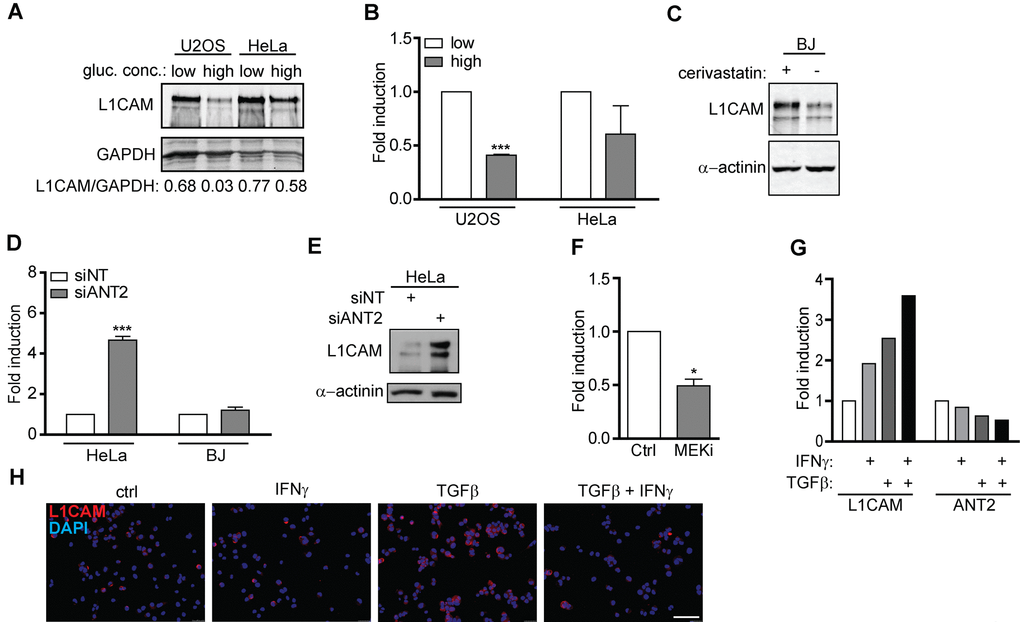
Figure 6.L1CAM expression is linked to metabolic changes. The effect of high (4.5 g/L) and low (1.0 g/L) glucose concentration in cultivation medium on total L1CAM protein (A) and L1CAM mRNA levels (B) in U2OS and HeLa cells detected by Western blotting and real time RT-PCR, respectively. (C) The effect of inhibition of the mevalonate pathway by cerivastatin on the L1CAM total protein level in BJ fibroblasts. L1CAM mRNA in HeLa and BJ cells (D) and total L1CAM protein in Hela cells (E) after downregulation of ANT2 using RNA interference. (F) ANT2 mRNA level after inhibition of MEK by selumetinib (10 μM; MEKi) in A375 cells. L1CAM and ANT2 transcripts (G) and L1CAM surface expression (H) in A375 cells exposed to 500 U/ml IFNγ, 10 ng/ml TGFβ, or their combination for 4 days. For real time RT-qPCR experiments, GAPDH was used as the reference gene. For immunoblotting, GAPDH or α-actinin were used as loading controls. p ˂ 0.05 (*); p ˂ 0.01 (**); p ˂ 0.001 (***), two-tailed Student’s t-test. Scale bar, 100 μm. All experiments were performed in three independent replicates.