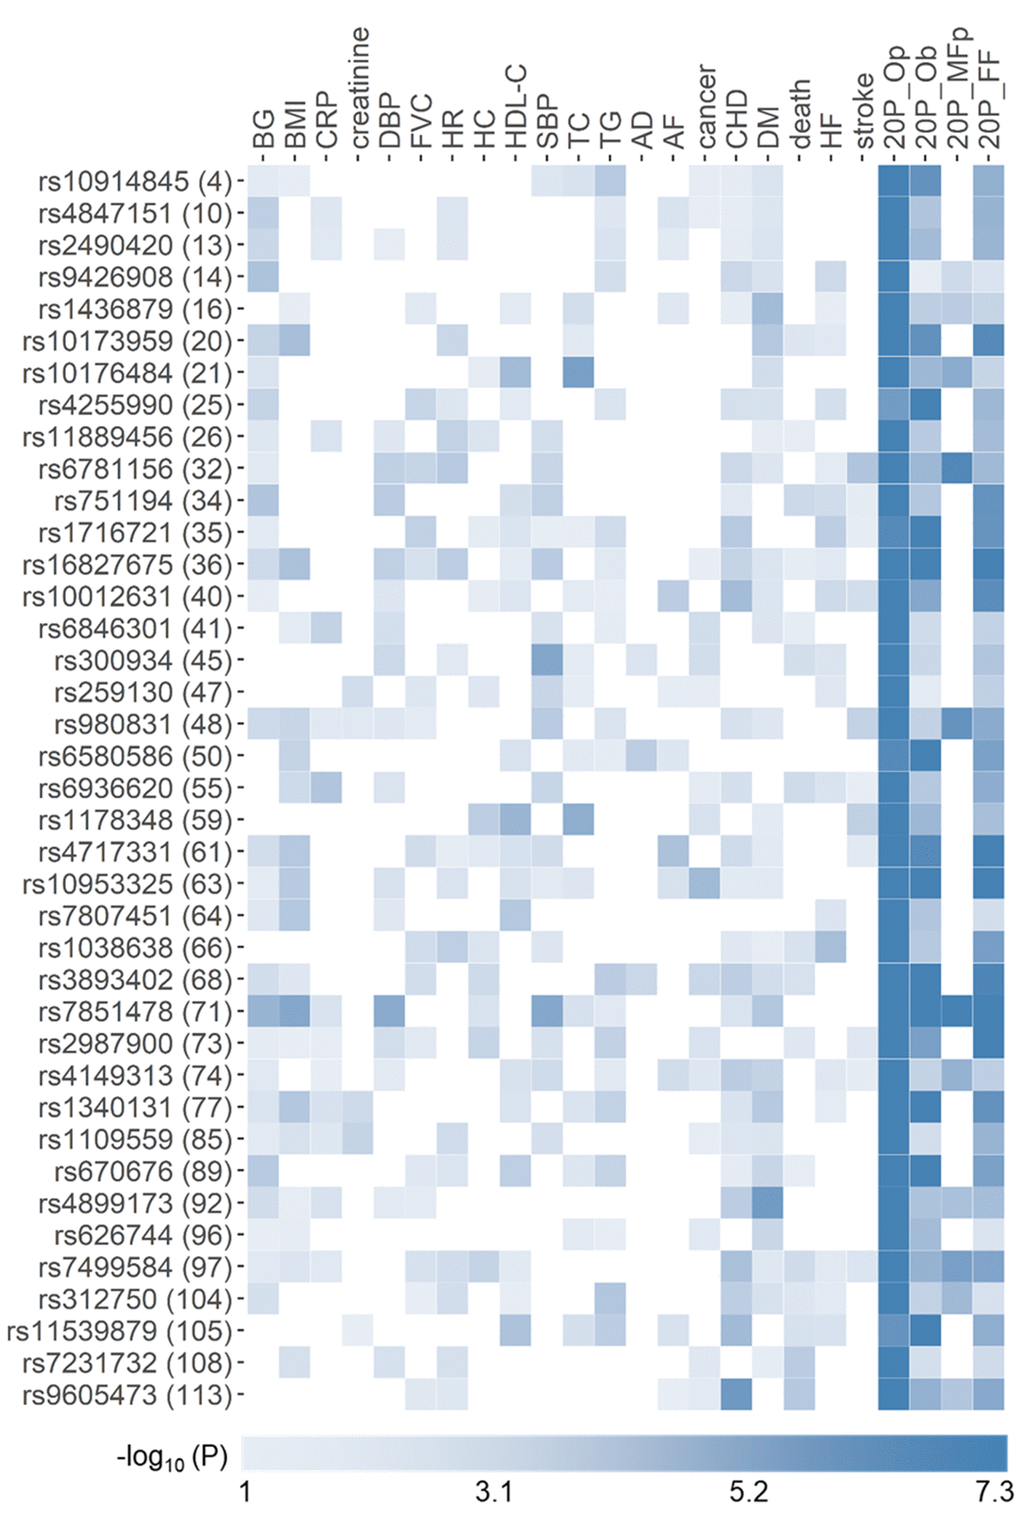
Figure 2.Heat map of phenotype-specific associations for selected pleiotropic SNPs. Data are for 39 novel SNPs with pleiotropic associations in the domains of all 20 phenotypes (20P) from Table 2. Numbers in parentheses are SNP IDs in Table 2. Phenotypes are defined in Table 1. FF, Op, and Ob denote pleiotropic meta-tests either from pathway 1 or 2 based on Fisher test, omnibus test with correlation matrix for phenotypes, and omnibus test with correlation matrix for effect statistics (Fig. 1), respectively. MFp denotes pleiotropic meta-tests from pathway 1 (Fig. 1). Colors code -log10(p-value) trimmed at GW level -log10(5×10⁻⁸)=7.3 for better resolution.