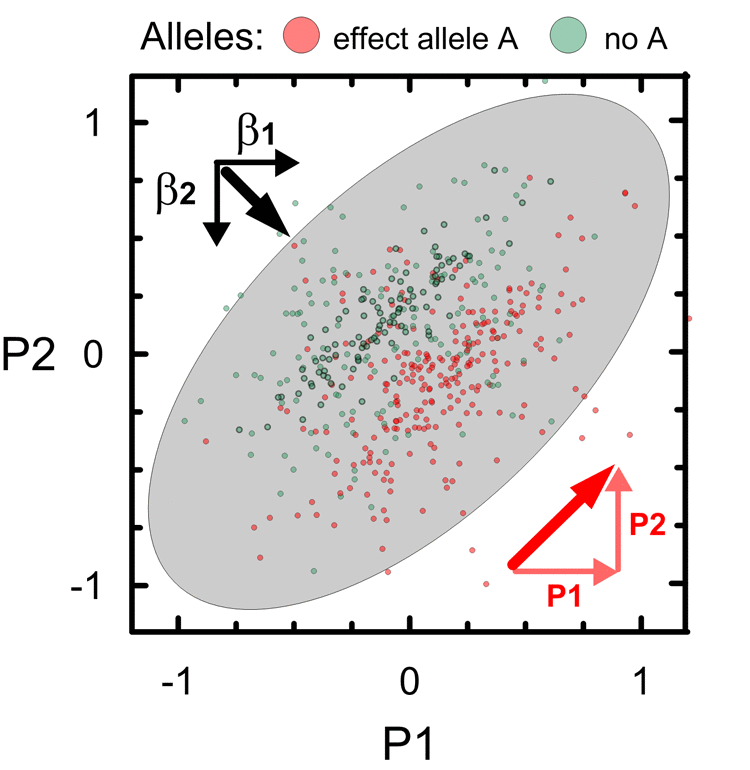
Figure 3.Schematic illustration of antagonistic genetic heterogeneity in the associations with two partly correlated age-related phenotypes P1 and P2. Small dots represent a sample of carriers of an effect allele A (red color) and those who do not carry this allele (no A; green color). Ellipse shows correlation of P1 and P2 in this sample (r=0.6). Red color denotes vector of correlation of P1 and P2 (thick diagonal vector) and its projections on phenotypes, i.e. P1 (horizontal) and P2 (vertical). Black vectors β1 and β2 denote the effects in the associations of allele A with P1 and P2. Sum of β1 and β2 represents bivariate vector (thick line) of the effects.