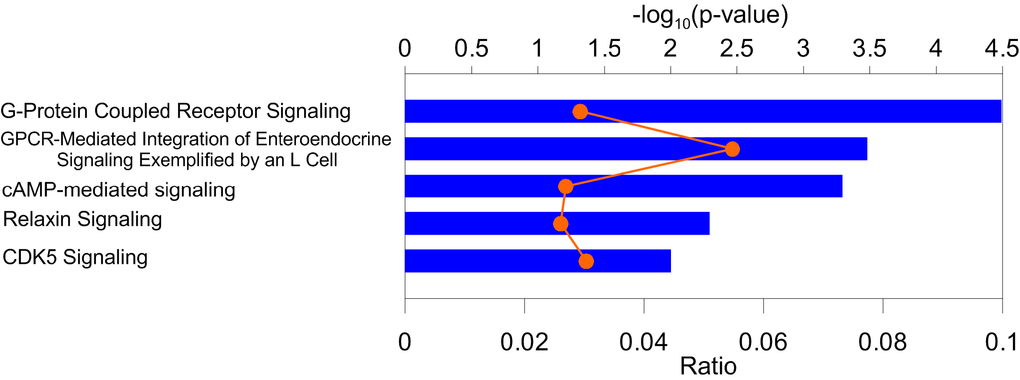
Figure 4.Enrichment of pathways in the Ingenuity Pathway Analysis (IPA) bioinformatics tool. Blue bars (upper x-axis) show –log10(p-value) for the top five IPA pathways. Proportion of genes from the identified sets to those in the IPA pathways (orange symbols and line) is shown on the lower x-axis. Numerical estimates are given Supplementary Table 10.