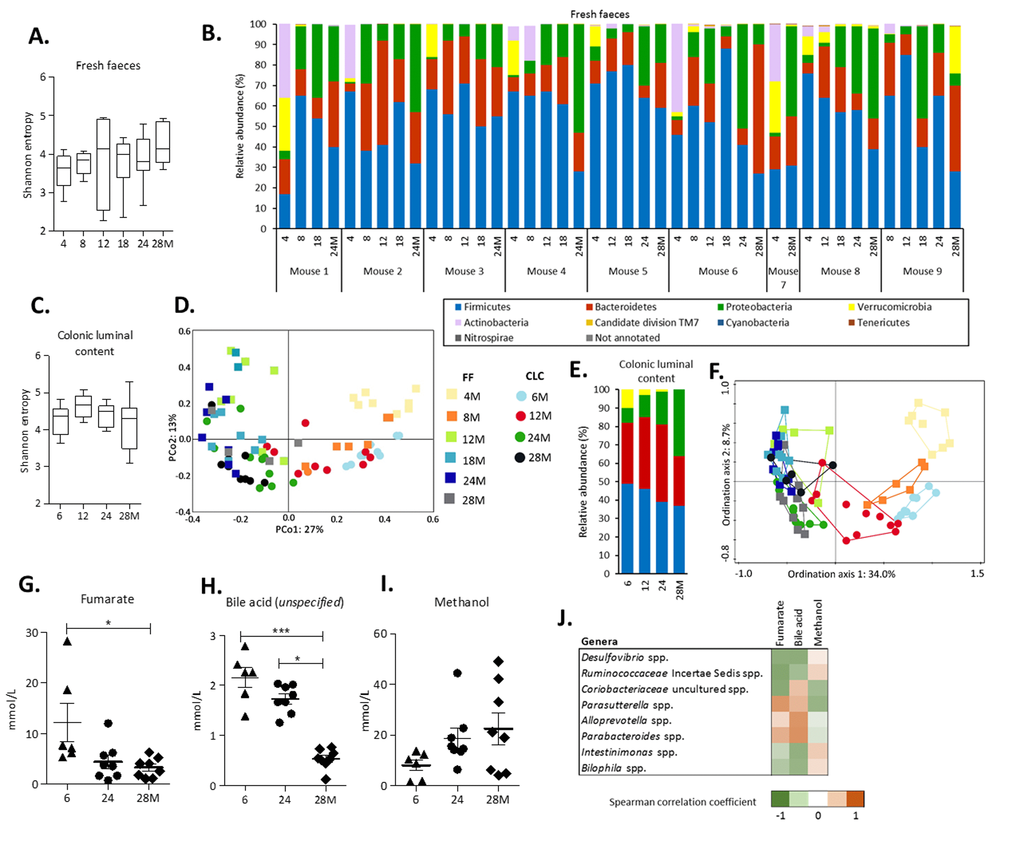
Figure 1.Alterations in gut microbiota composition and metabolites during aging. (A) The alpha-diversity (Shannon entropy) measured by the Shannon entropy in fresh faeces. Boxes extend from the 25th to 75th percentile, line in the middle represents median, and whiskers represent minimum and maximum values. (B) Relative abundance (%) at phylum level in fresh faeces collected longitudinally in a subset of 9 mice. (C) The alpha-diversity (Shannon entropy) measured by the Shannon entropy in colonic luminal content. (D) Principal Coordinate Analysis (PCoA) based on Bray-Curtis distances showing dissimilarities between all individual samples (FF and CLC). (E) The average relative abundance (%) at phylum level in colonic luminal content. Legend corresponds to graph with relative abundance at phylum level in fresh faeces. (F) Redundancy Analysis (RDA) displaying the part of the variation in microbiota composition explained by the age groups and source. Sample plot showing the clustering of the samples. Legend corresponds to PCoA plot. The distance between the ages and sample sources approximates the average dissimilarity of the microbiota composition. The FF analyses were based on a subset of n=9 mice at consecutive ages (4, 8, 12, 18, 24 and 28 months). For the CLC analyses, n=10 mice per age group (6, 12, 24 and 28 months) were included. (G) Levels of fumarate, (H) an unspecified bile acid and (I) methanol detected by 1H-NMR in CLC at 6 months (n=6), 24 months (n=8) and 28 months (n=8) of age. Error bars represent standard error of the mean (S.E.M.). (J) Strongest Spearman correlation coefficients (-0.60.6) for the concentrations of the identified metabolites and the relative abundances of the 50 most abundant genera in colonic luminal content.