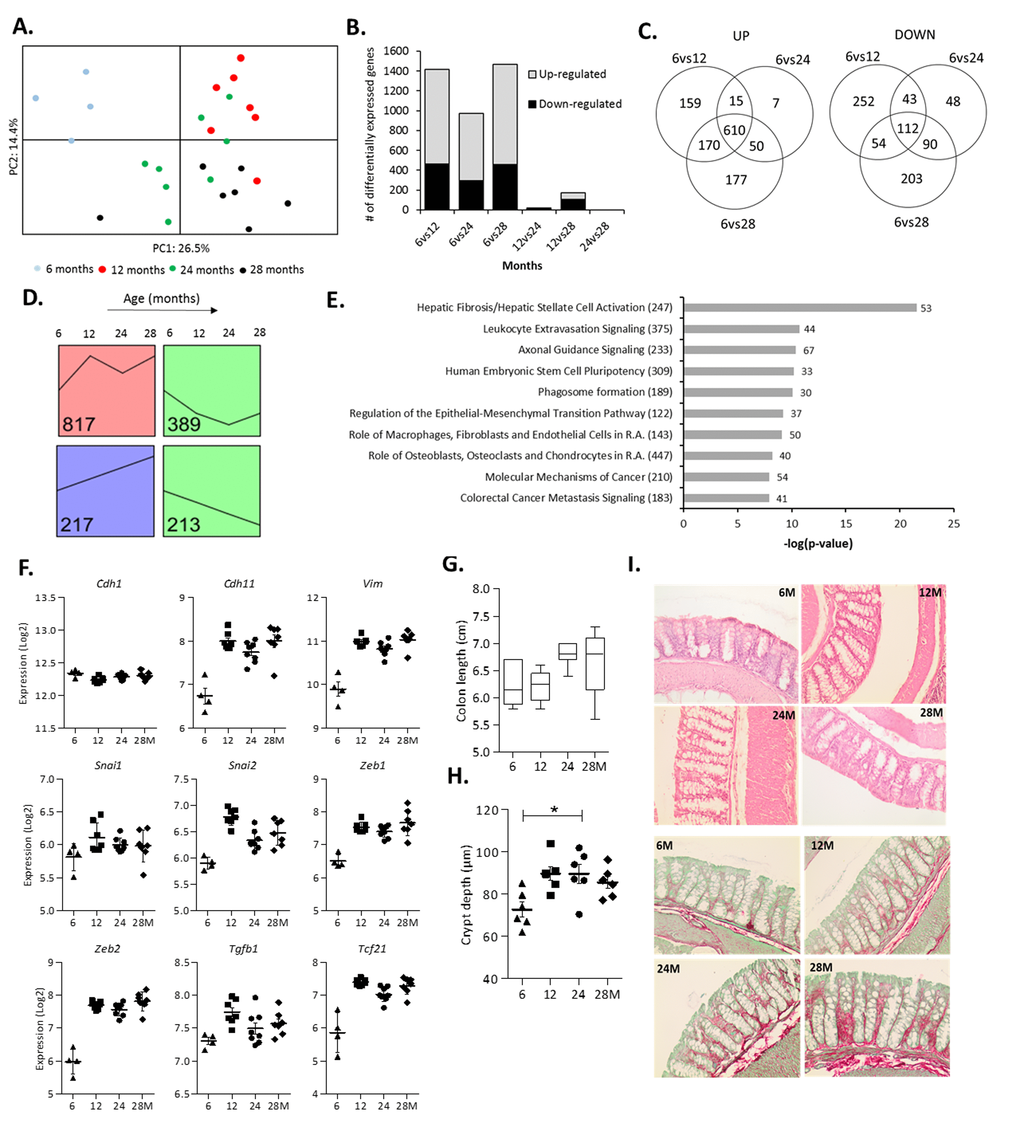
Figure 2.Changes in colonic gene expression in 6, 12, 24 and 28-month-old mice. (A) Principal Component Analysis (PCA) plot using the top 1,000 most variable genes showing the first 2 principal components. (B) The number of differentially expressed genes for all age comparisons (IBMT q<0.01). (C) Venn diagram showing the number of overlapping and unique differentially expressed genes between 6vs12, 6vs24 and 6vs28 months. (D) Each significantly differentially expressed gene (6vs12, 6vs24, 6vs28 months, q<0.01) was assigned to the model profile that most closely matched their gene expression profile, executed by STEM. The model profiles with the highest number of genes assigned to (as indicated by the number in the box) are shown. (E) Top 10 most significant canonical pathways between 6 and 12 months as determined by Ingenuity Pathway Analysis (R.A. = Rheumatoid Arthritis). Numbers behind bars represent the number of differentially expressed genes (IBMT q<0.01) and numbers behind the pathways represent the total number of genes. (F) The gene expression (Log2) of the epithelial marker E-cadherin (Cdh1), mesenchymal markers OB-cadherin (Cdh11) and Vimentin (Vim), transcription factors Snail Family Transcriptional Repressor 1 and 2 (Snai1, 2) and Zinc Finger E-Box Binding Homeobox 1 and 2 (Zeb1, 2), Transforming growth factor beta 1 (Tgfb1) and Transcription Factor 21 (Tcf21). (G) Length of the colon (cm) at sacrifice. (H) Depth of colonic crypts (μm) measured in H&E stained colon samples. (I) Representative pictures of Haematoxylin and Eosin (H&E) staining and Sirius Red/Fast Green staining of colon tissue at 6, 12, 24 and 28 months (200x magnification). Error bars reflect standard error of mean (S.E.M.). *p<0.05.