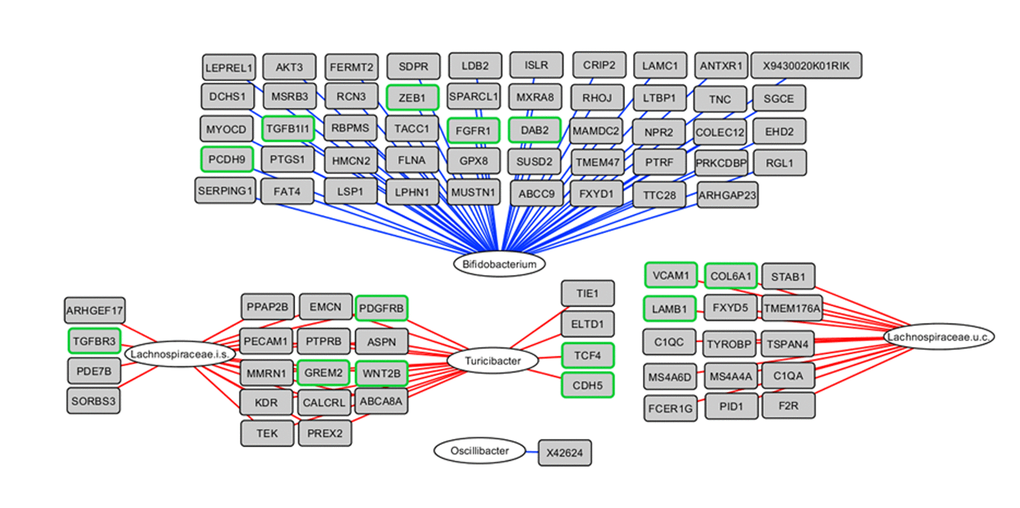
Figure 3.Integrative analysis of colonic microbiota composition and gene expression in the early phase of aging. The 817 up-regulated genes as determined by STEM were correlated with the 50 genera with a relative abundance ≥0.1% in at least 1 sample, including the mice aged 6 and 12 months. Relevance network showing the genera (white circles) and genes (grey rectangles) that were correlated (r<-0.80 or r>0.80). Red lines represent positive correlations, blue lines represent negative correlations. Regarding the negative correlations, only the top 50 strongest negative correlations are shown for visualization purposes. Genes with green frames are involved in EMT and/or ECM-related processes. i.s.=incertae sedis; u.c.: uncultured.